MotifView2: Difference between revisions
No edit summary |
|||
| (10 intermediate revisions by the same user not shown) | |||
| Line 1: | Line 1: | ||
{{ infobox Application | {{ infobox Application | ||
| title = '''MotifView - A motif viewing tool''' | | title = '''MotifView - A motif viewing tool''' | ||
| Line 8: | Line 7: | ||
| working_state = Released | | working_state = Released | ||
| tools = blastn, tblastx, blastz, CHAOS, LAGAN, DiAlign 2 | | tools = blastn, tblastx, blastz, CHAOS, LAGAN, DiAlign 2 | ||
}} | }} | ||
| Line 28: | Line 26: | ||
=Sequence Submission= | =Sequence Submission= | ||
Select the "Sequence Submission" tab to open these options. Here, you can specify sequence submission boxes for each sequence that will be submitted for a MotifView anlaysis. This is also were you can adjust the amount of sequence analyzed, select which sequences are analyzed, reverse complement a sequence, mask a sequence according | Select the "Sequence Submission" tab to open these options. Here, you can specify sequence submission boxes for each sequence that will be submitted for a MotifView anlaysis. This is also were you can adjust the amount of sequence analyzed, select which sequences are analyzed, reverse complement a sequence, mask a sequence according the genomic features it contains, and change the display order of sequences. | ||
The different options for submitting and modifying sequences to be visualized can be found [[GEvo#Adding_a_sequence|here]]. | The different options for submitting and modifying sequences to be visualized can be found [[GEvo#Adding_a_sequence|here]]. | ||
= Select Motifs = | = Select Motifs = | ||
| Line 50: | Line 45: | ||
Once motifs are chosen, press the "Find Motifs!" button above the tabs to begin analysis. | Once motifs are chosen, press the "Find Motifs!" button above the tabs to begin analysis. | ||
= Alignment Algorithms = | |||
While the default alignment algorithm will be useful for most queries, we've provided many major algorithms for use in alignment. The options and suitability of available algorithms is discussed [[GEvo#Alignment_Algorithms|here]]. | |||
=Results= | =Results= | ||
[[Image:Maize-sorghum-cns.png|thumb|right|500px| | [[Image:Maize-sorghum-cns.png|thumb|right|500px|This is not the final graphic (obviously) but one like it can be found here: http://synteny.cnr.berkeley.edu/CoGe/MotifViewTest.pl]] | ||
Each panel represents a genomic region, with the dashed line in the middle separating the top and bottom strands of the chromosome. Gene models are drawn as composite colored arrows above and below this line if they are read from the top and bottom strand respectively. Usually, the full gene is the gray arrow, on top of which is the mRNA (blue), on top of which is protein coding sequence ([[CDS]]). | |||
Motifs are indicated as either a diamond or a flag above the region in which they are present. Selecting any motif with a cursor will reveal information about the motif including name, sequence, and a full annotation link. | |||
There are other colors and icons that represent other types of genomic features that are described [[GenomeView_examples | here]. Above and below the gene models will be the identified regions of sequence similarity. These are represented by colored boxes. The location of the colored box above or below the dashed line signifies of whether the match is in the [[(++) or (+-) orientation]] respectively. Each pairwise comparison will have its regions of sequence similarity drawn in a separate track (both above and below the dashed line) and are usually different colors from one another (though that is configurable). To see which region matches which other region, just click on a colored box, and a transparent wedge will be drawn connecting it to its partner region. For more information about MotifView's interface, see the documentation on [[gobe]]. | |||
= Regenerating/Saving a MotifView Analysis = | = Regenerating/Saving a MotifView Analysis = | ||
| Line 68: | Line 67: | ||
* [[GEvo#Showing_Contigs|Show Contigs]] | * [[GEvo#Showing_Contigs|Show Contigs]] | ||
* [[GEvo# | * [[GEvo#Turning on labels for HSPs (blast hits) in GEvo's results|Turning on labels for HSPs]] | ||
* [[GEvo# | * [[GEvo#Turning on labels for Genomic Features (e.g. genes) in GEvo's results|Turn on labels for genomic features]] | ||
* [[GEvo# | * [[GEvo#Expanding Overlapping Features and Regions of Sequence Similarity|Expand overlapping features and regions of sequence similarity]] | ||
=Refining an analysis= | =Refining an analysis= | ||
Latest revision as of 17:47, 8 September 2011
MotifView is a tool that visualizes motifs in compared genomic regions.
Introduction
MotifView uses visual and algorithmic tools to visualize motifs within multiple genomic regions. Sharing many functional similarities to GEvo, it's possible to compare sequences from any number of organisms using a variety of different sequence comparison algorithms.
On this page we provide only a brief description of options that are shared with GEvo. If descriptions and directions are ambiguous, please follow the links to specific sections to the GEvo instructions on that section.
MotifView basics

- Select genomic regions to analyze
- Select a sequence alignment algorithm appropriate for the sequences and questions in mind
- Select motifs to visualize and how to visualize them
- Press "Find Motifs!" button
To alternate between areas to configure an analysis, select the appropriate tab.
Sequence Submission
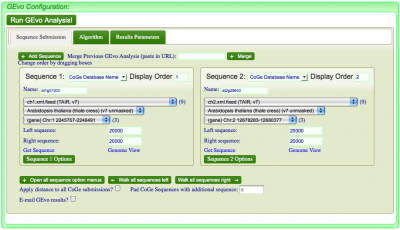
Select the "Sequence Submission" tab to open these options. Here, you can specify sequence submission boxes for each sequence that will be submitted for a MotifView anlaysis. This is also were you can adjust the amount of sequence analyzed, select which sequences are analyzed, reverse complement a sequence, mask a sequence according the genomic features it contains, and change the display order of sequences.
The different options for submitting and modifying sequences to be visualized can be found here.
Select Motifs
This tab allows the user to define how and which motifs will be found and analyzed.
Select Graphic Type
Determine if you'd like to see the motifs represented visually as a diamond or flag
Show Motifs overlapping with CNSs or any position in the Window
Motifs are often found within CNSs as protein binding sites or other functional DNA. However, motifs appear in many places and can be viewed anywhere in the window.
Choose TFBS Motif
You can manually enter a motif in the window next to "Enter TFBS Motif Regular Expression :".
Additionally, there is a choice of provided motif categories. On toggling any category a pull down list of motifs linked to that stress, transcription factor family, etc, will appear for selection. If desired, a range of motifs not confined to categories is available below the categories.
Once motifs are chosen, press the "Find Motifs!" button above the tabs to begin analysis.
Alignment Algorithms
While the default alignment algorithm will be useful for most queries, we've provided many major algorithms for use in alignment. The options and suitability of available algorithms is discussed here.
Results

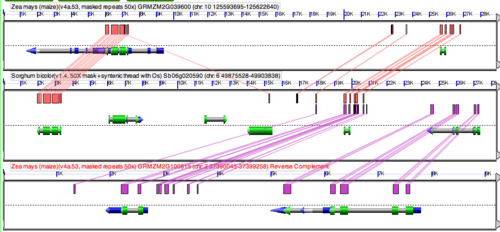
Each panel represents a genomic region, with the dashed line in the middle separating the top and bottom strands of the chromosome. Gene models are drawn as composite colored arrows above and below this line if they are read from the top and bottom strand respectively. Usually, the full gene is the gray arrow, on top of which is the mRNA (blue), on top of which is protein coding sequence (CDS).
Motifs are indicated as either a diamond or a flag above the region in which they are present. Selecting any motif with a cursor will reveal information about the motif including name, sequence, and a full annotation link.
There are other colors and icons that represent other types of genomic features that are described [[GenomeView_examples | here]. Above and below the gene models will be the identified regions of sequence similarity. These are represented by colored boxes. The location of the colored box above or below the dashed line signifies of whether the match is in the (++) or (+-) orientation respectively. Each pairwise comparison will have its regions of sequence similarity drawn in a separate track (both above and below the dashed line) and are usually different colors from one another (though that is configurable). To see which region matches which other region, just click on a colored box, and a transparent wedge will be drawn connecting it to its partner region. For more information about MotifView's interface, see the documentation on gobe.
Regenerating/Saving a MotifView Analysis

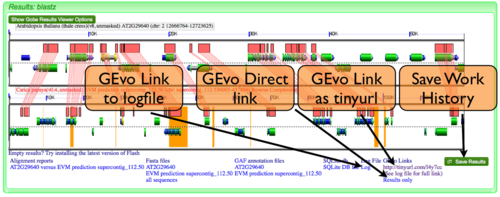
MotifView has the ability to regenerate past comparisons or save current comparisons. The ability to create links to, view, or save MotifView analyses is described in detail here.
Modifying result graphics
Many options are available to customize the graphics results in ways useful for visualizing both motifs and the surrounding DNA in the window. For example you may:
- Show Contigs
- Turning on labels for HSPs
- Turn on labels for genomic features
- Expand overlapping features and regions of sequence similarity
Refining an analysis
Once a MotifView analysis has run, you can change any of the analysis parameters and re-run the analysis by pressing the "Purge Results" button and "Find Motifs" button again. Notice most parameters will have set themselves to the default, including any changes in "Results Parameters" tab and genome being queried in the "Sequence Submissions" tab.
The common parameters changed are:
- Showing where the motifs overlap
- Choosing different motifs to find
- The extent of the genomic region analyzed. The interactive results make this easy with slider bars.
- The algorithm used in the analysis
- Masking sequences
- Skipping sequences
- Reverse complementing sequences
- The coloration and information displayed in the result's graphics
Hints and Tricks
Sequences with many common sub-sequences
Comparing sequences with lots of common sub-sequences usually causes GEvo to take a very long time processing the analysis (both in terms of identifying the common sequences and generating the final results). Also, if many regions are identified, it is often difficult to make sense of the results. This kind of problem will surface in many large genomes, such as mammal and plant genomes. For example human and maize are both riddled with large amounts of repetitive sequences derived from retroviruses and transposons. This makes the comparison of large genome regions in these genomes difficult, if not impossible. To circumvent this problem, mask all sequence that does not code for protein. You can select this option under the "Sequence options" menu and selecting "non-CDS" for the row "Mask Sequence".
Example Analyses
This needs to be either a tutorial or a real analysis. Probably the former.
Linking to GEvo
Linking to GEvo is easy! Please see this page on how.
