MotifView: Difference between revisions
Created page with '{{ infobox Application | title = '''GEvo - Genome Evolution Analysis''' | logo = Image:GEvo-logo.png | screenshot = 200px|thumb | caption = T...' |
No edit summary |
||
| (217 intermediate revisions by one other user not shown) | |||
| Line 1: | Line 1: | ||
{{ infobox Application | {{ infobox Application | ||
| title = ''' | | title = '''MotifView - A motif viewing tool''' | ||
| screenshot = [[Image:motifview_image.png|200px|thumb]] | |||
| screenshot = [[Image: | | caption = MotifView at work | ||
| caption = | |||
| developer = CoGe Team | | developer = CoGe Team | ||
| analysis = Compare multiple genomic regions for | | analysis = Compare multiple genomic regions for motifs | ||
| working_state = | | working_state = Testing | ||
| tools = blastn | | tools = blastn, LAGAN | ||
}} | }} | ||
MotifView is a tool that visualizes motifs in compared genomic regions. | |||
= Introduction = | = Introduction = | ||
MotifView uses visual and algorithmic tools to visualize motifs within multiple genomic regions. Sharing many functional similarities to GEvo, it's possible to compare sequences from any number of organisms using a variety of different sequence comparison algorithms. | |||
= | On this page we provide only a brief description of options that are shared with GEvo. If descriptions and directions are ambiguous, please follow the links to specific sections to the [[GEvo#GEvo|GEvo]] instructions on that section. | ||
[[Image: | |||
There's also the option to use the embedded videos to view demos of the sections following. One can either follow the text along with the video or choose to use either exclusively. | |||
=MotifView basics= | |||
[[Image:Motifview-setup.png|thumb|right|400px|Screen-shot of where a MotifView analysis is configured. Four genomic regions have been specified by gene name, dataset and the amount of additional upstream/downstream sequence]] | |||
# Select genomic regions to analyze | # Select genomic regions to analyze | ||
# Select a sequence alignment algorithm appropriate for the sequences and | # Select a sequence alignment algorithm appropriate for the sequences and area of interest | ||
# Press " | # Select motifs to visualize | ||
To alternate between | # Press "Find Motifs!" button | ||
To alternate between these options to configure an analysis, select the appropriate tab. | |||
=Sequence Submission= | =Sequence Submission= | ||
Select the "Sequence Submission" tab to open these options. Here, you can specify sequence submission boxes for each sequence that will be submitted for a | ===Manual Submission=== | ||
Select the "Sequence Submission" tab to open these options. Here, you can specify sequence submission boxes for each sequence that will be submitted for a MotifView anlaysis. This is also were you can adjust the amount of sequence analyzed, select which sequences are analyzed, reverse complement a sequence, mask a sequence according the the genomic features it contains, and change the display order of sequences. | |||
=== | ===Merge analysis=== | ||
Frequently users have links from previous GEvo analyses that they wish to screen for motifs. Pasting the link into the "Merge Previous GEvo Analysis" window allows panels created in GEvo to be analyzed in MotifView. | |||
The different options for submitting and modifying sequences to be visualized can be found [[GEvo#Adding_a_sequence|here]]. | |||
# | |||
= Alignment Algorithms = | |||
While many major algorithms exist for alignment, not all are suitable for the analysis available in MotifView. As such, MotifView compares genes at a scale that makes BlastN and LAGAN the most ideal algorithm choices. The options and suitability of available algorithms is discussed [[GEvo#Alignment_Algorithms|here]]. | |||
== | = Select Motifs = | ||
This tab allows the user to define how and which motifs will be found and analyzed. The "Select Motifs" tab contains four pull down options when choosing motifs for analysis. | |||
[[Image:Select-motifs.png|thumb|right|400px]] | |||
===Choose TFBS Motif=== | |||
Users can manually enter a motif in the section "Search for User-Defined Motifs". Also, while colors are automatically provided to motifs, users can define their own color separated from the motif by a colon. For example: | |||
CACGTG:Red | |||
=== | ===Select from Comprehensive List of Motifs=== | ||
It's also possible to browse the full list of motifs in our database and add them to be analyzed. In the window presenting the full list, motifs appear by name, then sequence. Information on highlighted motifs will pop up on pressing the "Get Motif Info" button. | |||
Once selected, the motif will appear in the "Selected Motifs" window where they can be additionally deselected or the list cleared entirely for a new list. | |||
===Select Motifs from Categories=== | |||
Additionally, there is a choice of provided motif categories: Stress and Families. Toggling any category will pull a down list of motifs linked to that stress or transcription factor family. If desired, a range of motifs not confined to categories is available below the categories. In addition, users can select or deselect all options in a category if needed. | |||
Once motifs are chosen, press the "Find Motifs!" button above the tabs to begin analysis. | |||
=Demo MotifView Analysis= | |||
Below is a demo basic MotifView analysis. In it we illustrate how to submit a region to be analyzed, how to choose an algorithm, relevant changes to the graphics, and how to choose motifs. | |||
[[Image:Demo-sequence-submission5.png|thumb|500px|right|Fig. 1 Sequence submission]] | |||
===Sequence Submission (Fig. 1)=== | |||
Enter the genomic region: | |||
#Enter a gene accession number in the box labeled "Name:". In this case, we've chosen AT3G11580 and AT5G06250, two homeologs with annotations that will be seen later. A list that identifies which datasets contain what annotations can be found [[Extra Annotations|here]]. | |||
#Choose datasets to be analyzed. When you enter the accession number, pull down menus will be populated with datasets that contain that gene, including genomic datasets, type of DNA, etc. This example requires that we use Arabidopsis TAIR V8 that has been masked for repeats. | |||
Additionally, you may define how many base pairs flank each genomic region. This will become more relevant when refining an analysis. | |||
===Algorithm (Fig. 2)=== | |||
[[Image:Demo-algorithm3.png|thumb|500px|left|Fig. 2 Algorithm]] | |||
#Next, the alignment algorithm must be chosen from the pulldown menu next to "Alignment Algorithm:". While many alignment algorithms exist, MotifView analyzes DNA within a very small defined region. As such, this example uses "BlastN" for this analysis since it works best when analyzing small regions. | |||
=== | ===Results Parameters (Fig. 3)=== | ||
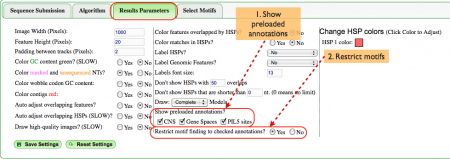
There are many options available for ease of use when viewing the analysis. In this example the most relevant options address annotations. | |||
# The gene pair we've selected includes annotations for CNSs, gene spaces, and PIL5 sites. As such, we definitely want to see said annotations in the final results so all three boxes are checked. | |||
# Further, it's possible to be overwhelmed by the number of motifs present in the imaging panel if a wide selection of motifs is chosen so we chose the option to only view motifs that overlap our annotations. | |||
[[Image:Demo-results-parameters5.png|thumb|450px|center|Fig. 3 Results Parameters]] | |||
=== | ===Select Motifs (Fig. 4)=== | ||
[[Image:Demo-motif-select-stress2.png|thumb|300px|right|Fig. 4 Select Motifs]] | |||
[[Image: | |||
Though users can define their own motifs or select from our full list of motifs as shown above, we're illustrating how categories of motifs can be analyzed. | |||
# Toggle "Select Motifs from Stress Categories". The expanding window allows the user to choose from stresses associated with motifs including Chemical/Oxidative/Pathogen, Cold, Drought/Heat, Hypoxia, Light, Nutrient, Salt, Water, and Unspecified stresses. | |||
# In this case, toggle the Cold Stress category. | |||
# To illustrate how one can search for a range of motifs, Select All motifs in the Cold Stress category. | |||
===MotifView Panel (Fig. 5)=== | |||
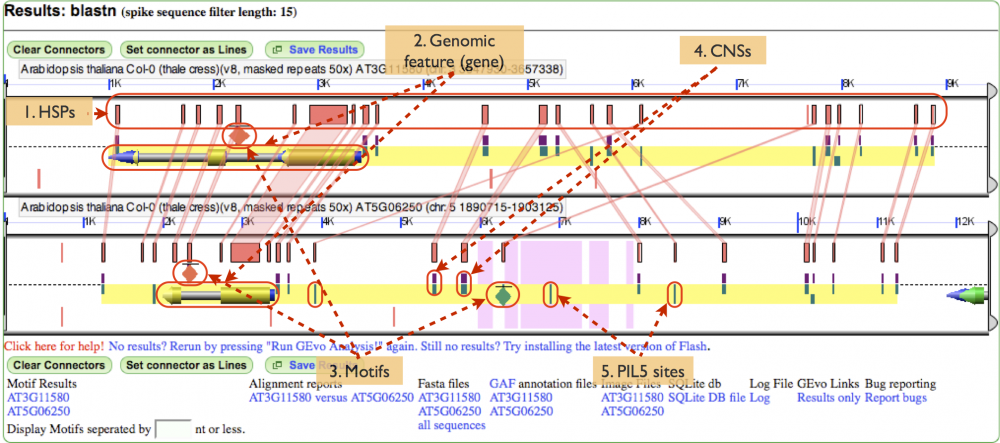
Below is the image of the analysis performed. Show in the panel are: | |||
# HSPs: A high-scoring segment pair, or HSP, is a subsegment of a pair of sequences. In this case, the HSPs have been toggled to show the regions of similarity between the gene pair. | |||
# Genomic features: The gene is shown with exons painted gold, the introns painted grey and non coding regions painted blue. Notice that that gene space is also highlighted by the yellow background underlying the gene and other annotations | |||
# Motifs: These annotations are painted on as diamonds. It's important to realize that the diamonds don't represent the real size of the motifs. Rather, the motifs must be artificially represented or, because of their small size, they won't be visible at all. Notice how the green motif appears to have an HSP associated with a PIL5 site on its homeolog. | |||
# CNSs: Conserved non-coding sequences are very prevalent in this gene pair and can be differentiated from the PIL5 sites by being colored half purple. | |||
# PIL5 sites: One type of annotation, PIL5 sites are transcription factor binding sites. Notice how some sites have HSPs associated with that denote sequence similarity with sites on the homeolog. | |||
[[Image:Demo-panel3.png|thumb|1000px|center|Fig. 5 MotifView Panel]] | |||
=Modifying result graphics= | =Modifying result graphics= | ||
===Show preloaded annotations=== | |||
An important feature when using MotifView is the ability to view other features such as CNSs. In the "Results Parameters" section there is the option to show preloaded annotations in the panel, including CNSs, genespace and PIL5 sites. | |||
Further, one can restrict viewing motifs anywhere except when overlapping with any preloaded annotations. This is especially important because motifs are painted larger in the panel than they would actually appear. Not painting the motifs larger would result in invisible motifs but this representation can appear to make motifs overlap with other features when they do not. Restricting visible motifs to those that overlap with annotations eliminates any such error. | |||
===Other useful graphics modifications=== | |||
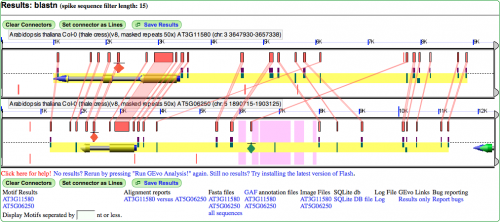
[[Image:Demo-panel2.png|thumb|right|500px|Example MotifView result with hsps, genomic feature, CNSs, PIL5 sites, genespace, and motifs drawn. Note that motifs are also only restricted to viewing those that overlap with genespace and PIL5 sites]] | |||
[[Image:Demo-results-parameters4.png|thumb|500px|right|Other useful graphic modifications in the Results Parameters tab]] | |||
[[GEvo#Showing_Contigs|Showing contigs]]. | |||
# | |||
[[GEvo#Turning_on_labels_for_HSPs_(blast_hits)_in_GEvo's_results | Turning on labels for HSPs]]. | |||
[[GEvo#Turning on labels for Genomic Features (e.g. genes) in GEvo's results|Drawing feature names on features]] | |||
[[ | |||
[[ | [[GEvo#Expanding_Overlapping_Features_and_Regions_of_Sequence_Similarity | Expanding Overlapping Features and Regions of Sequence Similarity]] | ||
=Refining an analysis= | |||
Once a MotifView analysis has run, any of the analysis parameters can be changed and re-run after pressing the "Clear all previous analysis" button. Some existing parameters will remain and other will have to be selected again. | |||
The common parameters changed are: | |||
*The extent of the genomic region analyzed. The amount to which the panel extends beyond the gene in question can be changed in the "Left sequence" and "Right sequence" boxes on the "Sequence Submission" tab. Changes to these boxes will remain in new analysis. | |||
*Reverse complementing sequences. This change will remain after previous analysis is cleared. | |||
*Also reset when previous analysis is cleared are the datasets for the sequence submissions, algorithm, and motifs selected. This means that this information will have to defined again after the user clears previous analysis | |||
= | =Linking to GEvo= | ||
Linking to GEvo is easy! Please see [[linking to GEvo|this page]] on how. | |||
= | =Tutorials = | ||
= | =References/Downloads= | ||
For a list of all datasets with annotations, click [[Extra Annotations|here]] | |||
For a list of all TFBS motifs used in Spangler et al., New Phytologist (2011) Evidence for Conserved Noncoding Sequence Functions in Arabidopsis thaliana. , click [http://coge.iplantcollaborative.org/CoGe/tmp/MotifView/MotifsUsedInSpanglerPaper.txt here] | |||
For a list of all TFBS motifs used in this site, click [http://coge.iplantcollaborative.org/CoGe/tmp/MotifView/Motiflist.txt here] | |||
= | =Frequently Asked Questions= | ||
= | =Bug Report= | ||
Progress on bugs can be found [[Motifview bugs|here]]. | |||
Latest revision as of 20:02, 20 November 2013
 MotifView at work | |
| Software company | CoGe Team |
|---|---|
| Analysis Type | Compare multiple genomic regions for motifs |
| Working state | Testing |
| Tools Utilized | blastn, LAGAN |
MotifView is a tool that visualizes motifs in compared genomic regions.
Introduction
MotifView uses visual and algorithmic tools to visualize motifs within multiple genomic regions. Sharing many functional similarities to GEvo, it's possible to compare sequences from any number of organisms using a variety of different sequence comparison algorithms.
On this page we provide only a brief description of options that are shared with GEvo. If descriptions and directions are ambiguous, please follow the links to specific sections to the GEvo instructions on that section.
There's also the option to use the embedded videos to view demos of the sections following. One can either follow the text along with the video or choose to use either exclusively.
MotifView basics
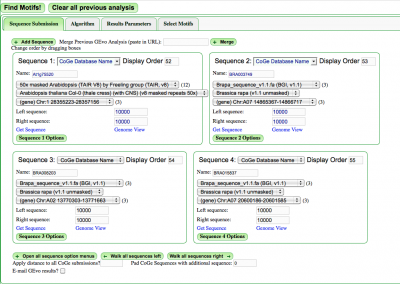
- Select genomic regions to analyze
- Select a sequence alignment algorithm appropriate for the sequences and area of interest
- Select motifs to visualize
- Press "Find Motifs!" button
To alternate between these options to configure an analysis, select the appropriate tab.
Sequence Submission
Manual Submission
Select the "Sequence Submission" tab to open these options. Here, you can specify sequence submission boxes for each sequence that will be submitted for a MotifView anlaysis. This is also were you can adjust the amount of sequence analyzed, select which sequences are analyzed, reverse complement a sequence, mask a sequence according the the genomic features it contains, and change the display order of sequences.
Merge analysis
Frequently users have links from previous GEvo analyses that they wish to screen for motifs. Pasting the link into the "Merge Previous GEvo Analysis" window allows panels created in GEvo to be analyzed in MotifView.
The different options for submitting and modifying sequences to be visualized can be found here.
Alignment Algorithms
While many major algorithms exist for alignment, not all are suitable for the analysis available in MotifView. As such, MotifView compares genes at a scale that makes BlastN and LAGAN the most ideal algorithm choices. The options and suitability of available algorithms is discussed here.
Select Motifs
This tab allows the user to define how and which motifs will be found and analyzed. The "Select Motifs" tab contains four pull down options when choosing motifs for analysis.
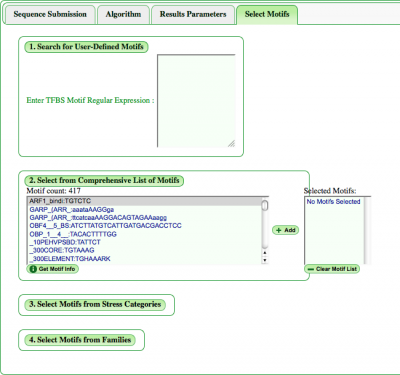
Choose TFBS Motif
Users can manually enter a motif in the section "Search for User-Defined Motifs". Also, while colors are automatically provided to motifs, users can define their own color separated from the motif by a colon. For example:
CACGTG:Red
Select from Comprehensive List of Motifs
It's also possible to browse the full list of motifs in our database and add them to be analyzed. In the window presenting the full list, motifs appear by name, then sequence. Information on highlighted motifs will pop up on pressing the "Get Motif Info" button.
Once selected, the motif will appear in the "Selected Motifs" window where they can be additionally deselected or the list cleared entirely for a new list.
Select Motifs from Categories
Additionally, there is a choice of provided motif categories: Stress and Families. Toggling any category will pull a down list of motifs linked to that stress or transcription factor family. If desired, a range of motifs not confined to categories is available below the categories. In addition, users can select or deselect all options in a category if needed.
Once motifs are chosen, press the "Find Motifs!" button above the tabs to begin analysis.
Demo MotifView Analysis
Below is a demo basic MotifView analysis. In it we illustrate how to submit a region to be analyzed, how to choose an algorithm, relevant changes to the graphics, and how to choose motifs.
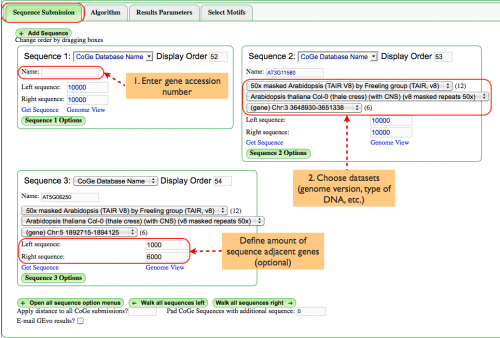
Sequence Submission (Fig. 1)
Enter the genomic region:
- Enter a gene accession number in the box labeled "Name:". In this case, we've chosen AT3G11580 and AT5G06250, two homeologs with annotations that will be seen later. A list that identifies which datasets contain what annotations can be found here.
- Choose datasets to be analyzed. When you enter the accession number, pull down menus will be populated with datasets that contain that gene, including genomic datasets, type of DNA, etc. This example requires that we use Arabidopsis TAIR V8 that has been masked for repeats.
Additionally, you may define how many base pairs flank each genomic region. This will become more relevant when refining an analysis.
Algorithm (Fig. 2)
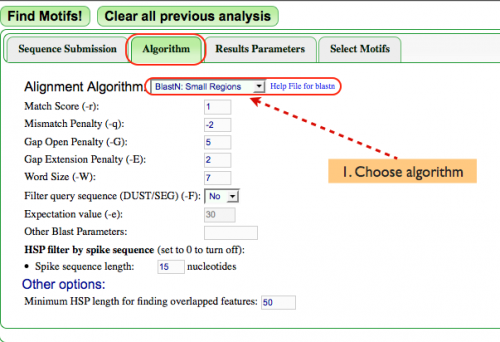
- Next, the alignment algorithm must be chosen from the pulldown menu next to "Alignment Algorithm:". While many alignment algorithms exist, MotifView analyzes DNA within a very small defined region. As such, this example uses "BlastN" for this analysis since it works best when analyzing small regions.
Results Parameters (Fig. 3)
There are many options available for ease of use when viewing the analysis. In this example the most relevant options address annotations.
- The gene pair we've selected includes annotations for CNSs, gene spaces, and PIL5 sites. As such, we definitely want to see said annotations in the final results so all three boxes are checked.
- Further, it's possible to be overwhelmed by the number of motifs present in the imaging panel if a wide selection of motifs is chosen so we chose the option to only view motifs that overlap our annotations.
Select Motifs (Fig. 4)
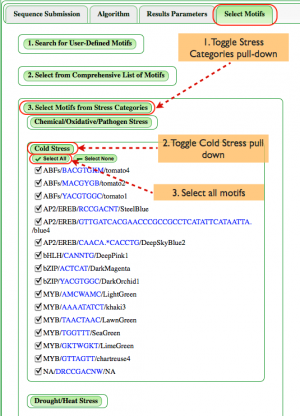
Though users can define their own motifs or select from our full list of motifs as shown above, we're illustrating how categories of motifs can be analyzed.
- Toggle "Select Motifs from Stress Categories". The expanding window allows the user to choose from stresses associated with motifs including Chemical/Oxidative/Pathogen, Cold, Drought/Heat, Hypoxia, Light, Nutrient, Salt, Water, and Unspecified stresses.
- In this case, toggle the Cold Stress category.
- To illustrate how one can search for a range of motifs, Select All motifs in the Cold Stress category.
MotifView Panel (Fig. 5)
Below is the image of the analysis performed. Show in the panel are:
- HSPs: A high-scoring segment pair, or HSP, is a subsegment of a pair of sequences. In this case, the HSPs have been toggled to show the regions of similarity between the gene pair.
- Genomic features: The gene is shown with exons painted gold, the introns painted grey and non coding regions painted blue. Notice that that gene space is also highlighted by the yellow background underlying the gene and other annotations
- Motifs: These annotations are painted on as diamonds. It's important to realize that the diamonds don't represent the real size of the motifs. Rather, the motifs must be artificially represented or, because of their small size, they won't be visible at all. Notice how the green motif appears to have an HSP associated with a PIL5 site on its homeolog.
- CNSs: Conserved non-coding sequences are very prevalent in this gene pair and can be differentiated from the PIL5 sites by being colored half purple.
- PIL5 sites: One type of annotation, PIL5 sites are transcription factor binding sites. Notice how some sites have HSPs associated with that denote sequence similarity with sites on the homeolog.
Modifying result graphics
Show preloaded annotations
An important feature when using MotifView is the ability to view other features such as CNSs. In the "Results Parameters" section there is the option to show preloaded annotations in the panel, including CNSs, genespace and PIL5 sites.
Further, one can restrict viewing motifs anywhere except when overlapping with any preloaded annotations. This is especially important because motifs are painted larger in the panel than they would actually appear. Not painting the motifs larger would result in invisible motifs but this representation can appear to make motifs overlap with other features when they do not. Restricting visible motifs to those that overlap with annotations eliminates any such error.
Other useful graphics modifications
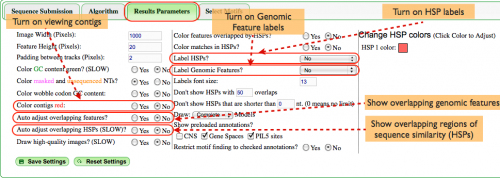
Drawing feature names on features
Expanding Overlapping Features and Regions of Sequence Similarity
Refining an analysis
Once a MotifView analysis has run, any of the analysis parameters can be changed and re-run after pressing the "Clear all previous analysis" button. Some existing parameters will remain and other will have to be selected again.
The common parameters changed are:
- The extent of the genomic region analyzed. The amount to which the panel extends beyond the gene in question can be changed in the "Left sequence" and "Right sequence" boxes on the "Sequence Submission" tab. Changes to these boxes will remain in new analysis.
- Reverse complementing sequences. This change will remain after previous analysis is cleared.
- Also reset when previous analysis is cleared are the datasets for the sequence submissions, algorithm, and motifs selected. This means that this information will have to defined again after the user clears previous analysis
Linking to GEvo
Linking to GEvo is easy! Please see this page on how.
Tutorials
References/Downloads
For a list of all datasets with annotations, click here
For a list of all TFBS motifs used in Spangler et al., New Phytologist (2011) Evidence for Conserved Noncoding Sequence Functions in Arabidopsis thaliana. , click here
For a list of all TFBS motifs used in this site, click here
Frequently Asked Questions
Bug Report
Progress on bugs can be found here.