Duckweed Genome GC bias assessment: Difference between revisions
Jump to navigation
Jump to search
No edit summary |
No edit summary |
||
| (2 intermediate revisions by the same user not shown) | |||
| Line 1: | Line 1: | ||
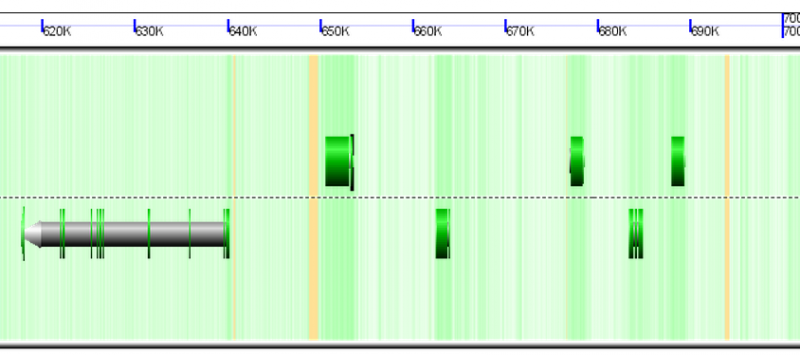
Summary: Duckweed's CDS sequences are GC biased, while the rest of the non-CDS genome is AT biased. | |||
[[File:Screen shot 2012-09-28 at 8.39.08 AM.png|thumb|800px|center|Screen shot of a region of the duckweed genome. Background is colored based on underlying GC content such that GC rich regions are green and AT rich regions are white. Gene models are composite colored arrows drawn above and below the dashed line in the center of the image. Green regions of gene models are CDS regions. Note that CDS regions correspond to an elevate GC content in genomic sequence.]] | |||
{| width="800" border="1" cellpadding="1" cellspacing="1" | {| width="800" border="1" cellpadding="1" cellspacing="1" | ||
|- | |- | ||
| Line 9: | Line 13: | ||
| Duckweed | | Duckweed | ||
| GC: 36.00% AT: 49.66% N: 14.34% X: 0.00% | | GC: 36.00% AT: 49.66% N: 14.34% X: 0.00% | ||
| | | [[File:Screen shot 2012-09-28 at 8.28.33 AM.png|thumb|center|300px]] | ||
| | | [[File:Screen shot 2012-09-28 at 8.28.42 AM.png|thumb|center|300px]] | ||
| | | [[File:Screen shot 2012-09-28 at 8.28.55 AM.png|thumb|center|300px]] | ||
|- | |- | ||
| Rice: http://genomevolution.org/CoGe/OrganismView.pl?dsgid=16888 | | Rice: http://genomevolution.org/CoGe/OrganismView.pl?dsgid=16888 | ||
Latest revision as of 15:41, 28 September 2012
Summary: Duckweed's CDS sequences are GC biased, while the rest of the non-CDS genome is AT biased.
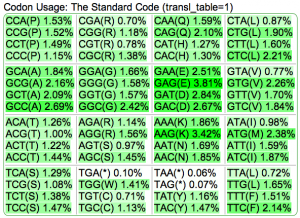
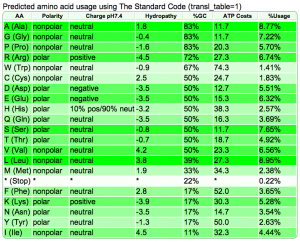
| Organism | Genome GC content | CDS GC content histogram | Codon usage | Amino acid usage |
| Duckweed | GC: 36.00% AT: 49.66% N: 14.34% X: 0.00% | 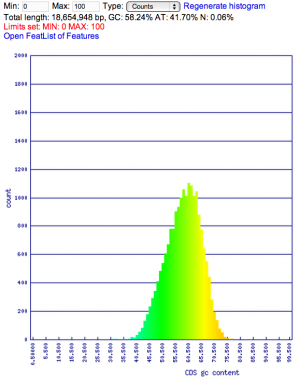 |
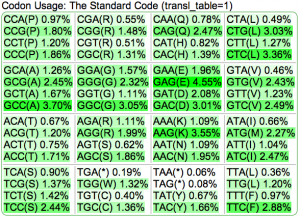 |
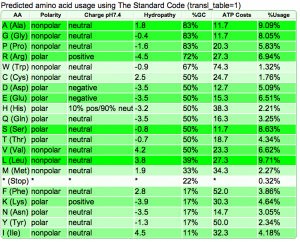 |
| Rice: http://genomevolution.org/CoGe/OrganismView.pl?dsgid=16888 | GC: 43.55% AT: 56.41% N: 0.04% X: 0.00% | 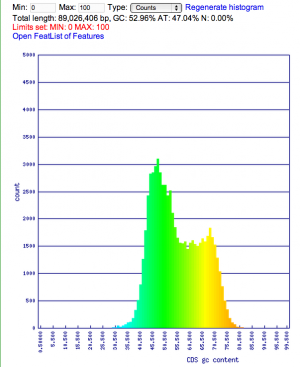 |
 |
 |