FractBias: Difference between revisions
No edit summary |
|||
| (66 intermediate revisions by the same user not shown) | |||
| Line 2: | Line 2: | ||
[[Whole genome duplication]]s (WGDs) and genome [[fractionation]] are covered more thoroughly in other CoGepedia entries. In short, WGDs create two or more copies of a genome: which are referred to as subgenomes. The duplicate subgenomes then undergo gene loss in a process called fractionation which is part of returning to a diploid state, [[diploidization]]. All things being equal, one may assume that fractionation would occur randomly across the redundant genes created after a WGD, however bias towards gene loss on one genome, called [[fractionation bias]], has been observed in several species including: maize <ref name="schnable | [[Whole genome duplication]]s (WGDs) and genome [[fractionation]] are covered more thoroughly in other CoGepedia entries. In short, WGDs create two or more copies of a genome: which are referred to as subgenomes. The duplicate subgenomes then undergo gene loss in a process called fractionation which is part of returning to a diploid state, [[diploidization]]. All things being equal, one may assume that fractionation would occur randomly across the redundant genes created after a WGD, however bias towards gene loss on one genome, called [[fractionation bias]], has been observed in several species including: maize <ref name="schnable | ||
_2011">[http://journal.frontiersin.org/article/10.3389/fpls.2011.00002/abstract Schnable, J.C. et al. Dose–sensitivity, conserved non-coding sequences, and duplicate gene retention through multiple tetraploidies in the grasses. Front. Plant Sci. http://dx.doi.org/10.3389/fpls.2011.00002 (2011)]</ref>, ''Brassica rapa'' <ref name="cheng_2012">[http://journals.plos.org/plosone/article?id=10.1371/journal.pone.0036442 Cheng, F. et al. Biased gene fractionation and dominant gene expression among the subgenomes of ''Brassica rapa''. PLOS ONE DOI: 10.1371/journal.pone.0036442 (2012)]</ref>, and rainbow trout <ref name="berthelot 2014">[http://www.nature.com/ncomms/2014/140422/ncomms4657/full/ncomms4657.html Berthelot, C. et al. The rainbow trout genome provides novel insights into evolution after whole-genome duplication in vertebrates. Nature Communications 5: DOI:10.1038/ncomms4657 (2014)]</ref>. | _2011">[http://journal.frontiersin.org/article/10.3389/fpls.2011.00002/abstract Schnable, J.C. et al. Dose–sensitivity, conserved non-coding sequences, and duplicate gene retention through multiple tetraploidies in the grasses. Front. Plant Sci. http://dx.doi.org/10.3389/fpls.2011.00002 (2011)]</ref>, ''Brassica rapa'' <ref name="cheng_2012">[http://journals.plos.org/plosone/article?id=10.1371/journal.pone.0036442 Cheng, F. et al. Biased gene fractionation and dominant gene expression among the subgenomes of ''Brassica rapa''. PLOS ONE DOI: 10.1371/journal.pone.0036442 (2012)]</ref>, and rainbow trout <ref name="berthelot 2014">[http://www.nature.com/ncomms/2014/140422/ncomms4657/full/ncomms4657.html Berthelot, C. et al. The rainbow trout genome provides novel insights into evolution after whole-genome duplication in vertebrates. Nature Communications 5: DOI:10.1038/ncomms4657 (2014)]</ref>. | ||
The FractBias code and an example data set can be found on [https://github.com/bjoyce3/SynMapFractBiasAnalysis GitHub] | |||
==Overview== | ==Overview== | ||
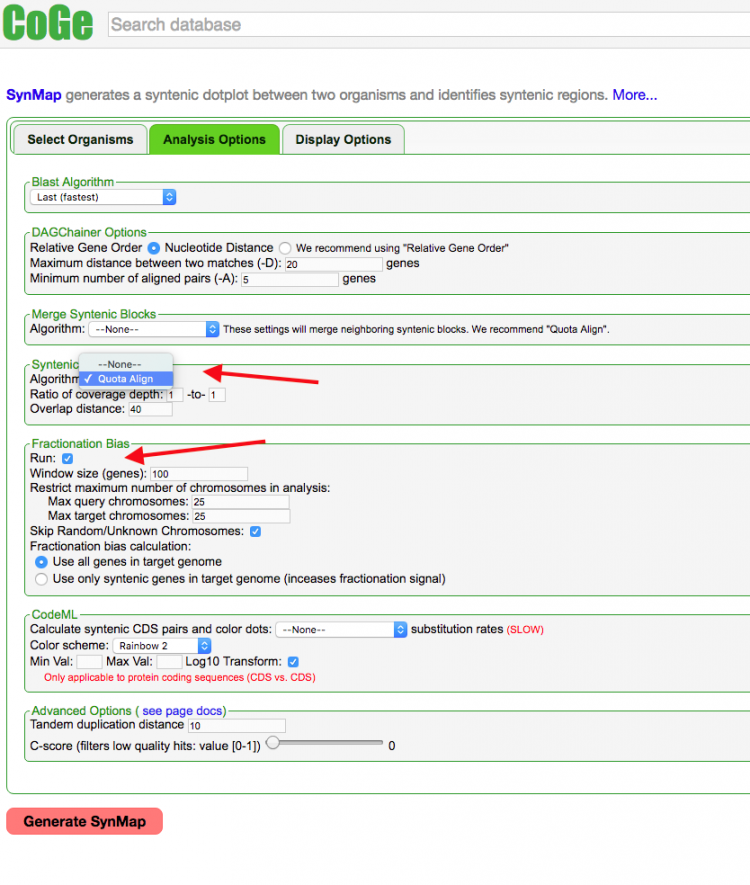
[[File: | [[File:Set_syntenicdepth.png|right|thumb|750px|'''Figure 1.''' Setting the SynMap syntenic depth and Run FractBias options (https://genomevolution.org/CoGe/SynMap.pl).]] | ||
===Workflow=== | |||
#SynMap comparison is carried out between two genomes with Syntenic Depth option set (Figure 1) | |||
#FractBias takes output and runs sliding window analysis | |||
#A figure with subplots for every target genome chromosome is created | |||
##x-axis: number of genes present on the chromosome in the target genome chromosome | |||
##y-axis: percentage of retained genes in each sliding window | |||
===What goes in=== | ===What goes in=== | ||
#Two assembled genomes that have annotated coding sequences (CDS) | #Two assembled genomes that have annotated coding sequences (CDS) | ||
| Line 13: | Line 22: | ||
#The full GFF of the target genome | #The full GFF of the target genome | ||
#The syntenic blocks identified by SynMap | #The syntenic blocks identified by SynMap | ||
# | #Parameters defined by the user | ||
##Window size in number of genes | |||
##How many total chromosomes should be used | |||
###The maximum number of query chromosome that should be considered | |||
###The maximum number of target chromosome that should be considered | |||
##Whether chromosomes containing the name 'unknown' or 'random' should be removed from consideration | |||
##What genes should be counted | ##What genes should be counted | ||
###Count all genes present on the target genome | ###Count all genes present on the target genome | ||
###Only count genes that are retained in both genomes | ###Only count genes that are retained in both genomes | ||
# | |||
# | |||
====Data files passed in==== | |||
#SynMap DAGChainer output: comparison_name.aligncoords.gcoords | |||
#GFF file for target genome | |||
===What comes out=== | ===What comes out=== | ||
| Line 25: | Line 42: | ||
#Links to the raw data used to create the subplots | #Links to the raw data used to create the subplots | ||
==FractBias | ==Fractionation Bias Examples== | ||
===Sorghum and Maize Fractionation Bias=== | |||
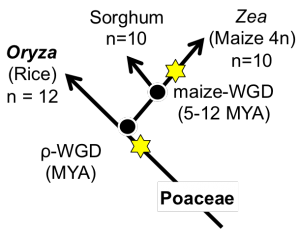
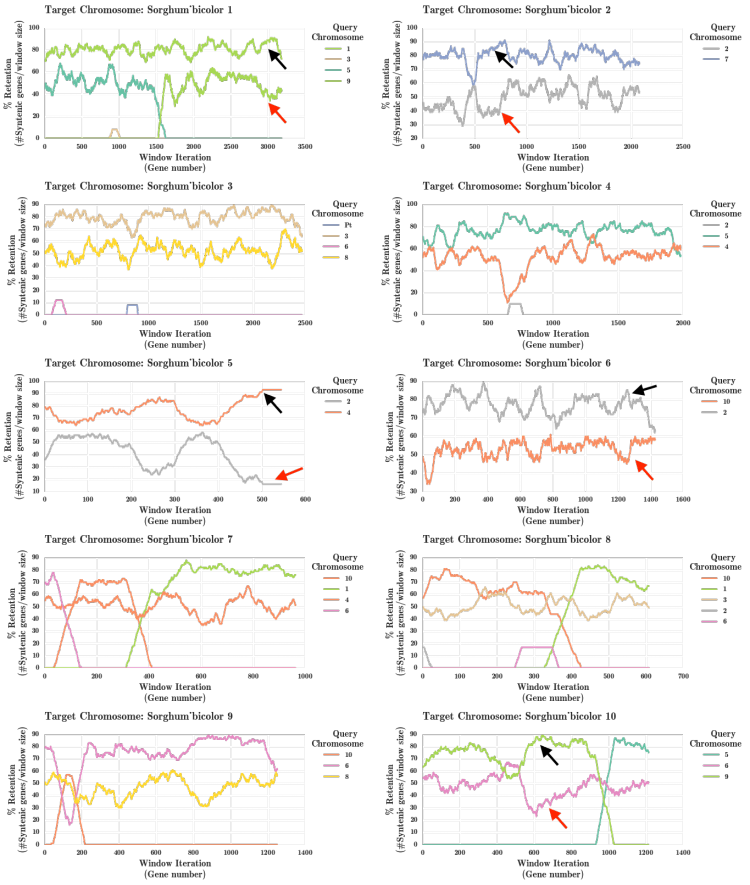
The fractionation bias in the maize genome has been previously studied<ref name= schnable_2011B></ref> independently. This analysis was rerun using the FractBias tool. Zea mays (maize) and Sorghum bicolor (sorghum) have recently diverged. Zea mays experienced a whole genome duplication (Figure 5), and so the syntenic depth ratio is sorghum 1:maize 2. Therefore, for each sorghum chromosome subplot there will be up to two chromosomes of maize present (Figure 6). Fractionation bias in maize chromosomes is present across almost all sorghum chromosomes except for sorghum chromosomes 8 and 10. Sorghum chromosomes 1, 7, 9, and 10 have more than two maize chromosomes represented. These indicate areas of the maize chromosomes that have recombined over the maize evolutionary history. | |||
[[File:wgds_monocots.png|left|thumb|300px|'''Figure 2.''' The fractionation bias that occurred after the maize whole genome duplication (WGD) has been studied previously<ref name= schnable_2011B>[http://www.pnas.org/content/108/10/4069 Schnable, J. C. et al. Differentiation of the maize subgenomes by genome dominance and both ancient and ongoing gene loss. PNAS 108:4069-4074]</ref> by comparing maize to sorghum. The WGDs events are denoted by stars along the Poaceae lineage. This analysis used the 'only retained genes' option to remove any genes unique to maize or sorghum. Link to regenerate analysis: ]] | |||
[[File:sorghum_maize_fractbias_onlyretained.png|right|thumb|750px|'''Figure 3.''' Results from running the FractBias tool. Areas of underfractionation (black arrows), intermediate fractionation (blue arrows), and overfractionation (red arrows) can be observed. .]] | |||
===''Arabidopsis thaliana'' and ''Brassica rapa'' Fractionation Bias=== | |||
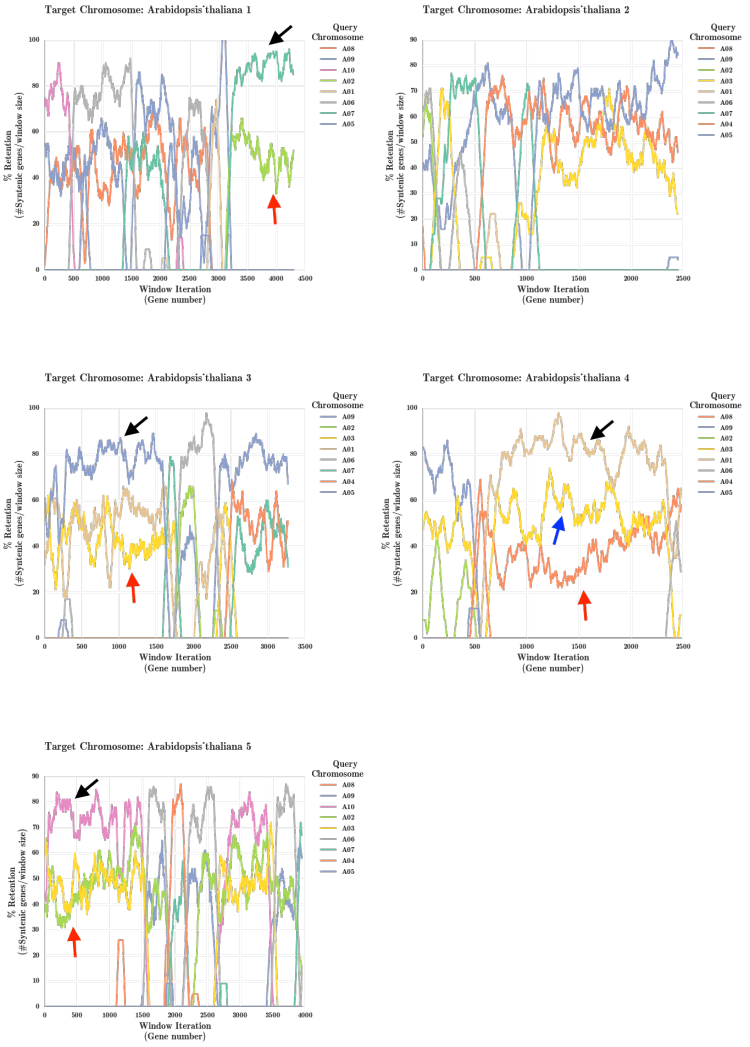
[[File:Athaliana_Brapa_onlysyntenic.png|middle|thumb|750px|'''Figure 4.''' Results from running the FractBias tool comparing ''Arabidopsis thaliana'' (target genome) to ''Brassica rapa'' (query genome). Areas of underfractionation (black arrows), intermediate fractionation (blue arrows), and overfractionation (red arrows) can be observed. Results can be regenerated https://genomevolution.org/r/k7jg.]] | |||
=== | ===Additional Examples=== | ||
More examples can be found in the table below. While FractBias was designed to investigate fractionation after whole genome duplications, it can also be used to investigate chromosome composition between species. | |||
[[File:Human_Pan_synmap.png|middle|thumb|750px|'''Figure 5.''' A syntenic depth ratio 1:1 comparison between the first 12 chromosomes of Homo sapiens and all the chromosomes of Pan troglodytes using the 'all genes' setting.]] | |||
{| class="wikitable" | {| class="wikitable" | ||
!colspan="6"|'''Table 1. | !colspan="6"|'''Table 1. FractBias examples available through CoGe’s SynMap. Syntenic depth ratios range from 1:1 to 1:6 using two species of plasmodia, two mammals, and six species of plants to highlight the flexibility and ease of use of FractBias. ''' | ||
|- | |- | ||
! scope="col"| | ! scope="col"|Target Species | ||
! scope="col"| | ! scope="col"|Query Species | ||
! scope="col"| | ! scope="col"|Syntenic Depth Ratio | ||
! scope="col"| | ! scope="col"|Link to 'All Genes' Analysis | ||
! scope="col"|Genes | ! scope="col"|Link to 'Only Syntenic Genes' Analysis | ||
|- | |- | ||
| style="text-align:center;" | | | style="text-align:center;" |Plasmodium falciparum | ||
| style="text-align:center;" | | | style="text-align:center;" |Plasmodium knowlesi | ||
| style="text-align:center;" |1 | | style="text-align:center;" |1:1 | ||
| style="text-align:center;" |https://genomevolution.org/r/k7j6 | |||
| style="text-align:center;" | | | style="text-align:center;" |https://genomevolution.org/r/k7km | ||
| style="text-align:center;" | | |||
|- | |- | ||
| style="text-align:center;" | | | style="text-align:center;" |Homo sapiens | ||
| style="text-align:center;" | | | style="text-align:center;" |Pan troglodytes | ||
| style="text-align:center;" | | | style="text-align:center;" |1:1 | ||
| style="text-align:center;" | | | style="text-align:center;" |https://genomevolution.org/r/k813 | ||
| style="text-align:center;" |https://genomevolution.org/r/k811 | |||
| style="text-align:center;" | | |||
|- | |- | ||
| style="text-align:center;" |Sorghum bicolor | |||
| style="text-align:center;" |Zea mays | |||
| style="text-align:center;" |1:2 | |||
| style="text-align:center;" |https://genomevolution.org/r/k7jx | |||
| style="text-align:center;" |https://genomevolution.org/r/k7j3 | |||
|- | |- | ||
| style="text-align:center;" | | | style="text-align:center;" |Brassica rapa | ||
| style="text-align:center;" | | | style="text-align:center;" |Brassica napus | ||
| style="text-align:center;" |1 | | style="text-align:center;" |1:2 | ||
| style="text-align:center;" | | | style="text-align:center;" |https://genomevolution.org/r/k7mw | ||
| style="text-align:center;" | | | style="text-align:center;" |https://genomevolution.org/r/k7k3 | ||
|- | |- | ||
| style="text-align:center;" | | | style="text-align:center;" |Arabidopsis thaliana | ||
| style="text-align:center;" | | | style="text-align:center;" |Brassica rapa | ||
| style="text-align:center;" | | | style="text-align:center;" |1:3 | ||
| style="text-align:center;" | | | style="text-align:center;" |https://genomevolution.org/r/k7jq | ||
| style="text-align:center;" | | | style="text-align:center;" |https://genomevolution.org/r/k7jg | ||
|- | |- | ||
| style="text-align:center;" | | | style="text-align:center;" |Vitis vinifera | ||
| style="text-align:center;" | | | style="text-align:center;" |Arabidopsis thaliana | ||
| style="text-align:center;" | | | style="text-align:center;" |1:4 | ||
| style="text-align:center;" | | | style="text-align:center;" |https://genomevolution.org/r/k7p1 | ||
| style="text-align:center;" | | | style="text-align:center;" |https://genomevolution.org/r/k7ov | ||
|- | |- | ||
| style="text-align:center;" | | | style="text-align:center;" |Arabidopsis thaliana | ||
| style="text-align:center;" | | | style="text-align:center;" |Brassica napus | ||
| style="text-align:center;" | | | style="text-align:center;" |1:6 | ||
| style="text-align:center;" | | | style="text-align:center;" |https://genomevolution.org/r/k7qz | ||
| style="text-align:center;" | | | style="text-align:center;" |https://genomevolution.org/r/k7r6 | ||
|} | |} | ||
==References== | ==References== | ||
{{reflist}} | {{reflist}} | ||
Latest revision as of 20:04, 1 September 2016
Background
Whole genome duplications (WGDs) and genome fractionation are covered more thoroughly in other CoGepedia entries. In short, WGDs create two or more copies of a genome: which are referred to as subgenomes. The duplicate subgenomes then undergo gene loss in a process called fractionation which is part of returning to a diploid state, diploidization. All things being equal, one may assume that fractionation would occur randomly across the redundant genes created after a WGD, however bias towards gene loss on one genome, called fractionation bias, has been observed in several species including: maize [1], Brassica rapa [2], and rainbow trout [3].
The FractBias code and an example data set can be found on GitHub
Overview
Workflow
- SynMap comparison is carried out between two genomes with Syntenic Depth option set (Figure 1)
- FractBias takes output and runs sliding window analysis
- A figure with subplots for every target genome chromosome is created
- x-axis: number of genes present on the chromosome in the target genome chromosome
- y-axis: percentage of retained genes in each sliding window
What goes in
- Two assembled genomes that have annotated coding sequences (CDS)
- A syntenic ratio set by the user (identified by empiric tests outside of the FractBias tool)
- The genome with a lower ratio will be the target genome
- The genome with a higher ratio will be the query genome
- The full GFF of the target genome
- The syntenic blocks identified by SynMap
- Parameters defined by the user
- Window size in number of genes
- How many total chromosomes should be used
- The maximum number of query chromosome that should be considered
- The maximum number of target chromosome that should be considered
- Whether chromosomes containing the name 'unknown' or 'random' should be removed from consideration
- What genes should be counted
- Count all genes present on the target genome
- Only count genes that are retained in both genomes
Data files passed in
- SynMap DAGChainer output: comparison_name.aligncoords.gcoords
- GFF file for target genome
What comes out
- A figure containing a subplot for every target genome chromosome
- Links to the raw data used to create the subplots
Fractionation Bias Examples
Sorghum and Maize Fractionation Bias
The fractionation bias in the maize genome has been previously studied[4] independently. This analysis was rerun using the FractBias tool. Zea mays (maize) and Sorghum bicolor (sorghum) have recently diverged. Zea mays experienced a whole genome duplication (Figure 5), and so the syntenic depth ratio is sorghum 1:maize 2. Therefore, for each sorghum chromosome subplot there will be up to two chromosomes of maize present (Figure 6). Fractionation bias in maize chromosomes is present across almost all sorghum chromosomes except for sorghum chromosomes 8 and 10. Sorghum chromosomes 1, 7, 9, and 10 have more than two maize chromosomes represented. These indicate areas of the maize chromosomes that have recombined over the maize evolutionary history.
Arabidopsis thaliana and Brassica rapa Fractionation Bias
Additional Examples
More examples can be found in the table below. While FractBias was designed to investigate fractionation after whole genome duplications, it can also be used to investigate chromosome composition between species.
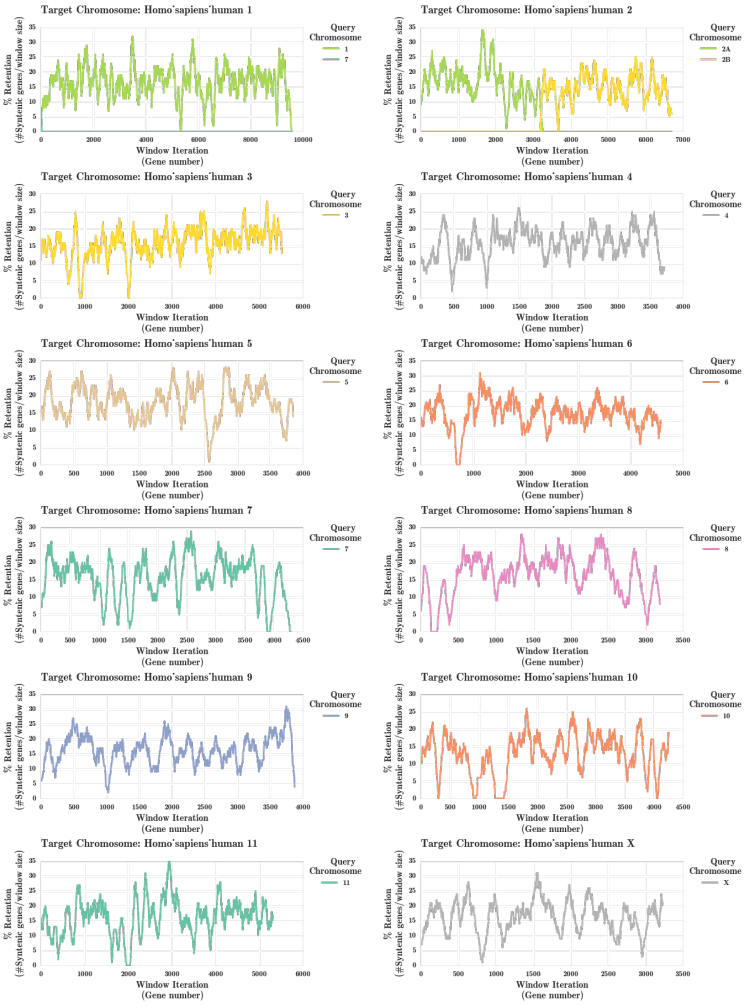
| Table 1. FractBias examples available through CoGe’s SynMap. Syntenic depth ratios range from 1:1 to 1:6 using two species of plasmodia, two mammals, and six species of plants to highlight the flexibility and ease of use of FractBias. | |||||
|---|---|---|---|---|---|
| Target Species | Query Species | Syntenic Depth Ratio | Link to 'All Genes' Analysis | Link to 'Only Syntenic Genes' Analysis | |
| Plasmodium falciparum | Plasmodium knowlesi | 1:1 | https://genomevolution.org/r/k7j6 | https://genomevolution.org/r/k7km | |
| Homo sapiens | Pan troglodytes | 1:1 | https://genomevolution.org/r/k813 | https://genomevolution.org/r/k811 | |
| Sorghum bicolor | Zea mays | 1:2 | https://genomevolution.org/r/k7jx | https://genomevolution.org/r/k7j3 | |
| Brassica rapa | Brassica napus | 1:2 | https://genomevolution.org/r/k7mw | https://genomevolution.org/r/k7k3 | |
| Arabidopsis thaliana | Brassica rapa | 1:3 | https://genomevolution.org/r/k7jq | https://genomevolution.org/r/k7jg | |
| Vitis vinifera | Arabidopsis thaliana | 1:4 | https://genomevolution.org/r/k7p1 | https://genomevolution.org/r/k7ov | |
| Arabidopsis thaliana | Brassica napus | 1:6 | https://genomevolution.org/r/k7qz | https://genomevolution.org/r/k7r6 | |
References
- ↑ Schnable, J.C. et al. Dose–sensitivity, conserved non-coding sequences, and duplicate gene retention through multiple tetraploidies in the grasses. Front. Plant Sci. http://dx.doi.org/10.3389/fpls.2011.00002 (2011)
- ↑ Cheng, F. et al. Biased gene fractionation and dominant gene expression among the subgenomes of Brassica rapa. PLOS ONE DOI: 10.1371/journal.pone.0036442 (2012)
- ↑ Berthelot, C. et al. The rainbow trout genome provides novel insights into evolution after whole-genome duplication in vertebrates. Nature Communications 5: DOI:10.1038/ncomms4657 (2014)
- ↑ 4.0 4.1 Schnable, J. C. et al. Differentiation of the maize subgenomes by genome dominance and both ancient and ongoing gene loss. PNAS 108:4069-4074