Syntenic dotplot of peach versus grape: Difference between revisions
No edit summary |
No edit summary |
||
| Line 1: | Line 1: | ||
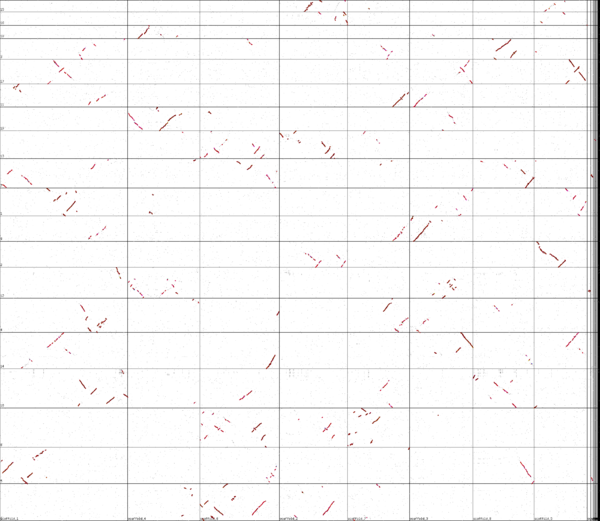
[[Image:Syntenic dotplot Prunus persica peach versus Vitis vinifera grapevine.png|thumb|right|600px|Syntenic dotplot of Prunus persica (peach; x-axis) and Vitis vinifera (grapevine; y-axis). Results can be regenerated at http://genomevolution.org/CoGe/SynMap.pl?dsgid1=8400;dsgid2=43;c=4;D=20;g=10;A=5;Dm=0;gm=;w=0;b=1;ft1=1;ft2=1;ma=1;do1=1;do2=1;do=40;dt=geneorder;ks=1;am=g]] | [[Image:Syntenic dotplot Prunus persica peach versus Vitis vinifera grapevine.png|thumb|right|600px|Syntenic dotplot of Prunus persica (peach; x-axis) and Vitis vinifera (grapevine; y-axis). Syntenic gene pairs have been colored based on their [[Ks values]]. Results can be regenerated at http://genomevolution.org/CoGe/SynMap.pl?dsgid1=8400;dsgid2=43;c=4;D=20;g=10;A=5;Dm=0;gm=;w=0;b=1;ft1=1;ft2=1;ma=1;do1=1;do2=1;do=40;dt=geneorder;ks=1;am=g]] | ||
Whole genome syntenic comparison of peach tree's genome to grapevine's shows extensive synteny where each region of each genome matching one other region very well, and two other regions less well. | Whole genome syntenic comparison of peach tree's genome to grapevine's shows extensive synteny where each region of each genome matching one other region very well, and two other regions less well. While the colors are a bit difficult to differentiate in this image, the better matching regions are a deeper red, signifying a lower Ks value. These regions are derived from the divergence of these lineages are are orthologs, the other regions being out-paralogous and derived from their shared [[eudicot paleohexaploidy]] event. | ||
This analysis also shows that peach, like grapevine, has not undergone a subsequent whole genome duplication event. Overall, the structure of these genomes is very similar as evidenced by the large syntenic orthologous regions. However, peachtree's lower chromosome number is likely due to chromosome fusion events of chomosomes that have mostly remained separated in grapevine. | |||
Revision as of 01:09, 10 April 2010

Whole genome syntenic comparison of peach tree's genome to grapevine's shows extensive synteny where each region of each genome matching one other region very well, and two other regions less well. While the colors are a bit difficult to differentiate in this image, the better matching regions are a deeper red, signifying a lower Ks value. These regions are derived from the divergence of these lineages are are orthologs, the other regions being out-paralogous and derived from their shared eudicot paleohexaploidy event.
This analysis also shows that peach, like grapevine, has not undergone a subsequent whole genome duplication event. Overall, the structure of these genomes is very similar as evidenced by the large syntenic orthologous regions. However, peachtree's lower chromosome number is likely due to chromosome fusion events of chomosomes that have mostly remained separated in grapevine.