SynMap: Difference between revisions
Jump to navigation
Jump to search
No edit summary |
|||
| Line 12: | Line 12: | ||
==Example Results== | ==Example Results== | ||
[[Image:Master_3068_8.CDS-CDS.blastn_geneorder_D20_g10_A5.w2000.ks.png|thumb|right|600px|Syntenic dotplot between ''Arabidopsis thaliana'' and ''Arabidopsis lyrata''. Syntenic gene pairs identified by DAGChainer have been colored based on their synonymous rate change as calculated by CODEML. Results can be regenerated [http://synteny.cnr.berkeley.edu/CoGe/SynMap.pl?dsgid1=3068;dsgid2=8;D=20;g=10;A=5;w=0;b=1;ft1=1;ft2=1;dt=geneorder;ks=1;autogo=1 here] ]]. | [[Image:Master_3068_8.CDS-CDS.blastn_geneorder_D20_g10_A5.w2000.ks.png|thumb|right|600px|Syntenic dotplot between ''Arabidopsis thaliana'' and ''Arabidopsis lyrata''. Syntenic gene pairs identified by DAGChainer have been colored based on their synonymous rate change as calculated by CODEML. Results can be regenerated [http://synteny.cnr.berkeley.edu/CoGe/SynMap.pl?dsgid1=3068;dsgid2=8;D=20;g=10;A=5;w=0;b=1;ft1=1;ft2=1;dt=geneorder;ks=1;autogo=1 here]. ]] | ||
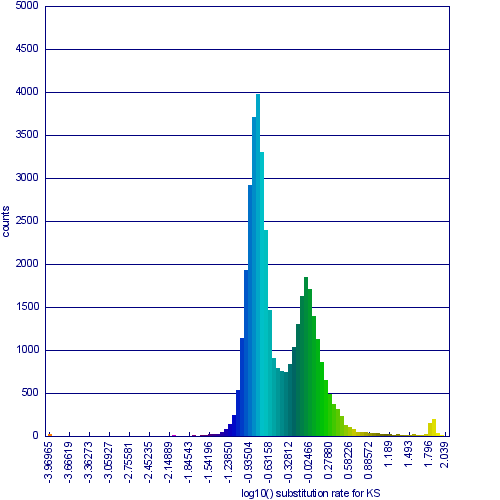
[[Image:Master 3068 8.CDS-CDS.blastn geneorder D20 g10 A5.w2000.ks.hist-1.png|thumb|right|600px|Histogram of synonymous rate change data for syntenic gene pairs between Arabidopsis thaliana and Arabidopsis lyrata.]] | |||
Revision as of 18:37, 27 August 2009
Overview
Specifying genomes
DAGChainer options
SynMap options
Calculating and displaying synonymous/non-synonymous (kS, kN) data
Interacting with results
Example Results

