SynMap: Difference between revisions
No edit summary |
No edit summary |
||
| Line 12: | Line 12: | ||
==Example Results== | ==Example Results== | ||
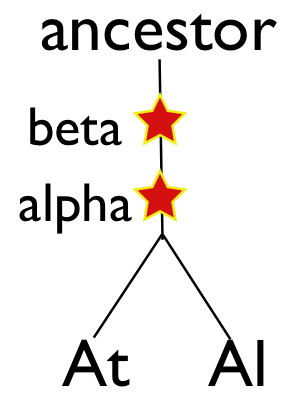
[[Image:PastedGraphic-1-.png|thumb|right| | [[Image:PastedGraphic-1-.png|thumb|right|300px|Diagram showing ancestral WGD events, alpha and beta, before lineage divergence in ''Arabidopsis'']] | ||
Revision as of 19:25, 2 October 2009
Overview
Specifying genomes
DAGChainer options
SynMap options
Calculating and displaying synonymous/non-synonymous (kS, kN) data
Interacting with results
Example Results


Please refer to the appropriate images for this discussion, or you can regenerate this analysis here. This example shows a whole genome syntenic dotplot comparison of Arabidopsis thaliana (At) and Arabidopsis lyrata (Al). These taxa diverged from one another ~5MYA [1] and share two sequential whole genome duplications events [2] since the divergence of their lineage with Carica papaya's lineage [3]. Each whole genome duplication event creates a contemporaneous copy of every chromosome and all the genetic information they contain. However, over evolutionary time, these duplicated homeologous chromosomes are fractionated, undergo rearrangement and inversions, gene transposition events, and other genomic changes. In addition, duplicated genes that are retained (as well as surrounding non-coding sequence) will diverge from one another. Coding sequence divergence can be measured by synonymous changes (Ks), and a population of contemporaneously created syntenic genes pairs from a whole genome duplication event will create characteristic peaks in a histogram of Ks values [4].
Shared whole genome duplication events can be detected through syntenic dotplot analysis (spacial analysis of gene order) and through synonymous change rate (Ks) histograms (temporal analysis of coding sequence divergence) for putative homologous gene pairs. SynMap can combine these approaches and can identify collinear sets of putatively homologous genes (spatial detection of synteny), calculate Ks values for these syntelogous gene pairs (temporal calculation of synteny), and use those Ks values to generate a color-metric histogram and paint the syntelogs the appropriate color on the dotplot. This combination of temporal and spatial syntenic analysis creates a final image that permits the rapid visual identification and evaluation of shared whole genome duplication events.
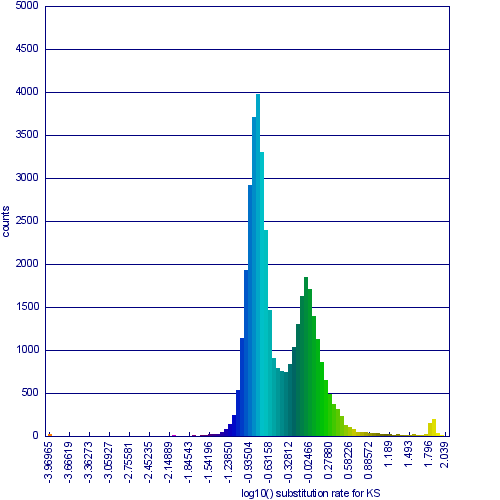
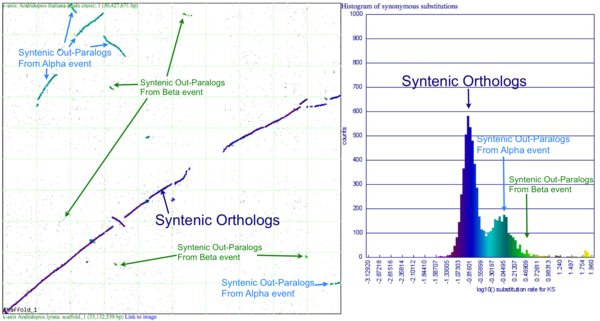
Figure 1a shows a syntenic dotplot between the genomes of At (y-axis) and Al (x-axis) laid on each axis. These plots are generated by comparing every coding sequence between these taxa using blastn in order to identify putatively homologous gene pairs. These results are used by DAGChainer to find collinear sets of genes shared between the taxa. The combined data-set is plotted according to their relative genomic position where each putative homologous gene pair is plotted with a gray dot, and syntenic gene pairs are plotted with a color based on their Ks value. The comparison of At and Al's genomes shows two significant patterns of synteny. First, these two genomes have syntenic regions identified by bright-green lines that are derived from the speciation divergence of these two taxa. Socond, there are smaller blocks of yellow-green lines that are derived from their shared whole genome duplication event (WGD) know as alpha[2]. Comparison to the Ks histogram (Figure 1B) shows that the bright-green has smaller Ks values (fewer changes) than the yellow-green line, which is to be expected as their divergence post-dates their shared whole genome duplication event.
Generating a close-up view of the comparison of chromosome one from both taxa (Figure 2), reveals a similar pattern (light-blue orthologs, light-green out-paralogs derived from their shared most recent whole genome duplication event), with additional evidence of the more ancient shared whole genome duplication event known as beta[2]. The beta whole genome duplication event is visualized by much smaller identified syntenic regions colored in yellow-orange. These syntenic gene-pairs correlate to a smaller peak in the Ks histogram with a larger mean Ks value than the subsequent whole genome duplication even (alpha) or the orthologs derived from the divergence of these taxa.
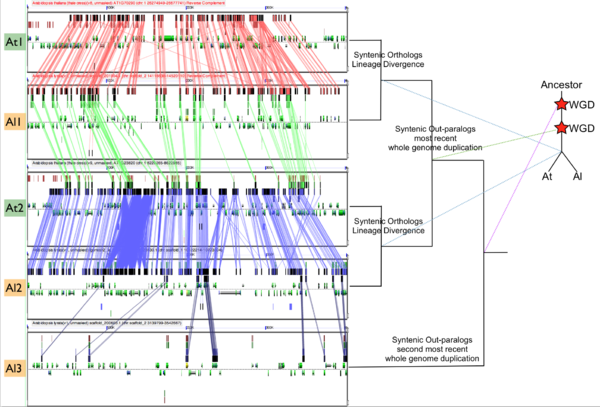
In order to validate and access the types and patterns of change at these genomic loci, high-resolution analysis of these syntenic regions can be performed using GEvo, and selecting the appropriate set of genomic regions using SynMap's interface. Such an analysis can be seen in figure 3 which compares five syntenic regions from these taxa. Two pairs of regions, At1-Al1 and At2-Al2, are orthologous and derived from the speciation of these lineages. This is evidenced by the high degree of spatial evidence for synteny between these regions (pink and blue lines) where nearly every gene in these regions has an orthologous partner in a collinear arrangement. These two pairs of regions are also syntenic with respect to one another (green lines) and are derived from their shared most recent whole genome duplication event (WGD) known as alpha. These four regions are syntenic to an additional region, Al3, which is derived from these lineages' shared second most recent whole genome duplication event known as beta. Syntenic genes are connected between Al2 and Al3 using dark blue lines, and note the lower density of syntenic gene pairs than for regions derived from the most recent WGD and the speciation of the lineages. While not shown in this figure, there is a syntenic region in At to Al3 from the speciation of these taxa, and two addition syntenic regions (one from each lineage) derived from the alpha whole genome duplication.
Please note that the Ks histogram is using log10 transformed Ks values. While many people set an upper cutoff for Ks values (usually at 2), these histograms show all values. The peak in the both these Ks histograms (Mean Ks ~ 65) at the far right and colored red is the result from mis-called syntenic gene pairs, genes whose alignments are very poor (e.g. due to a frame-shift mutation or pseudogenization), or from an error in the Ks calculation.
- ↑ Lysak MA, Berr A, Pecinka A, Schmidt R, McBreen K, Schubert I. Mechanisms of chromosome number reduction in Arabidopsis thaliana and related Brassicaceae species. Proceedings of the National Academy of Sciences of the United States of America. 2006 Mar 28;103(13):5224-5229.
- ↑ 2.0 2.1 2.2 Bowers JE, Chapman BA, Rong JK, Paterson AH. Unravelling angiosperm genome evolution by phylogenetic analysis of chromosomal duplication events. Nature. 2003;422:433–438.
- ↑ Ming R, Hou S, Feng Y, Yu Q, Dionne-Laporte A, Saw JH, Senin P, Wang W, Ly BV, Lewis KL, et al. The draft genome of the transgenic tropical fruit tree papaya (Carica papaya Linnaeus). Nature. 2008;452:991–996. doi: 10.1038/nature06856.
- ↑ Blanc, G., and K. H. Wolfe. 2004. Widespread paleopolyploidy in model plant species inferred from age distributions of duplicate genes. Plant Cell 16:1667-1678