SynMap: Difference between revisions
| Line 34: | Line 34: | ||
*'''Master image width:''' How wide, in pixels, will the master dotplot image be? Dynamic scales it according to the size of the genome, but sometimes it is necessary to make them very large to see some details. | *'''Master image width:''' How wide, in pixels, will the master dotplot image be? Dynamic scales it according to the size of the genome, but sometimes it is necessary to make them very large to see some details. | ||
*'''Calculate substitute rates for syntenic protein coding gene pairs and color syntenic dots accordingly''' | *'''Calculate substitute rates for syntenic protein coding gene pairs and color syntenic dots accordingly''' | ||
**This is the option to set if you want to calculate synonymous, nonsynonymous, or the ratio of those and color syntenic gene pair dots based on those values. This is very helpful if there are whole genome duplication events in one or both genomes. PLEASE NOTE: generating these values takes a long time. It takes a very long time for large genomes. | **This is the option to set if you want to calculate synonymous, nonsynonymous, or the ratio of those and color syntenic gene pair dots based on those values. This is very helpful if there are whole genome duplication events in one or both genomes. When these values are generated, a histogram of the values will also be generated and displayed. The histogram will be color coded identically to the dots in the dotplot. This makes it easy to determine which sytnenic gene pair dots are older or newer than other syntenic dots. PLEASE NOTE: generating these values takes a long time. It takes a very long time for large genomes. | ||
*'''Order contigs by best syntenic path:''' this option will invoke a special algorithm to rearrange contigs in order to create the best order of contigs that make a continous syntenic path in relation to a reference genome. This is very useful for a genome sequences that have been assembled to contigs for which a reference genome is available. PLEASE NOTE: that this ordering of contigs may not be how the genome is actually structured. Some genomic changes, such as large-scale [[inversions]] will not be correctly placed if the contigs' break-points are at the end of the inversion. This is often the case as inversions happen in repetitive sequence, and these same repetitive sequence are often where genome assembly algorithms cannot assemble through. | *'''Order contigs by best syntenic path:''' this option will invoke a special algorithm to rearrange contigs in order to create the best order of contigs that make a continous syntenic path in relation to a reference genome. This is very useful for a genome sequences that have been assembled to contigs for which a reference genome is available. PLEASE NOTE: that this ordering of contigs may not be how the genome is actually structured. Some genomic changes, such as large-scale [[inversions]] will not be correctly placed if the contigs' break-points are at the end of the inversion. This is often the case as inversions happen in repetitive sequence, and these same repetitive sequence are often where genome assembly algorithms cannot assemble through. | ||
Revision as of 17:38, 30 December 2009

Overview
SynMap allows you to generate a syntenic dotplot between two organisms and identify syntenic regions. This is done by:
- Finding putative genes or regions of homology between two genomes
- Identifying collinear sets of genes or regions of sequence similarity to infer synteny
- Generating a dotplot of the results and coloring syntenic pairs.
If you choose, synonymous and non-synonymous site mutation data can be calculated for protein coding genes that are identified as syntenic. These genes will then be colored based on those values in the dotplot for rapid identification of different age-classes of syntenic regions.
Specifying genomes

It is easy to search and select organisms in SynMap. Just select the "select organisms" tab and search for two organisms by either name or organism description. Just type part of either in the text box and SynMap automatically searches for any organism that contains your text. The results are displayed below the search boxes. Some organisms may have multiple versions of their genome and different types of sequences (e.g. masked versus unmasked). These will be displayed in a drop-down menu from which you can select the correct genome. Also, this is where you can select for comparing CDS sequence or genomic sequence. If the genome does not have CDS features, the option won't be display and a warning will be printed in below these drop-down menus. When selected, a brief description of the genome will be displayed below the drop-down menus. This will include the full organism name and description, followed by an overview of the genome. If you click on "Genome Information:" it will link to OrganismView and give you a full description of the genome. Otherwise, it will display source of the genome, the number of chromosomes in the genome, the total length of the genome in nucleotides, and whether the genome contains plasmids or contigs.
DAGChainer options

DAGChainer is the algorithm used for finding series of collinear genes (or regions of sequence similarity) between two genomes in order to infer synteny. To specify DAGChainer options, select the "DAGChainer Options" tab. DAGChainer works by searching some distance from a pair of genes for another pair. If some threshold number of gene pairs are identified, DAGChainer keeps that set of gene-pairs which will be reported back to SynMap. These sets of gene pairs are interpreted as two syntenic regions, and get colored in the dotplot for easy identification.
The options you can specify are:
- Are genomic coordinates in genes or nucleotide units ("Relative Gene Order" and "Nucleotide Distance" respectively).
- This determines whether DAGChainer is searching by number of genes (or regions of sequence similarity) or by absolute genomic nucleotide distances. For the most part, using "relative gene order" is preferable. The absolute distance between genes in nucleotides varies widely between genomes, and even within a genome. For the former, gene spacing in a bacteria genome are orders of magnitude closer than for an animal genome. For the latter, genes near centromeres are often further from one another than genes distal to a centromere. This is very apparent in plant genomes.
- Average distance expected between syntenic genes
- Maximum distance between two matches
- These two options are self explanatory. One thing to keep in mind is that the larger these values are set, the more generous DAGChainer is in including genes in a collinear set. In other words, as these values are increased, your false positive rate goes up. Also, the "average distance" should be lower than "maximum distance".
- Minimum number of aligned pairs
- This is the minimum number of gene-pairs that DAGChainer needs in a collinear gene set to keep. The higher this number, the more stringent DAGChainer will be for finding "good" collinear gene sets.
SynMap options
- Blast Algorithm: blastn: nucleotide-nucleotide search; tblastx: translated nucleotide-translated nucleotide search
- tblastx takes 6 times longer than blastn and usually doesn't improve the ability to find synteny. If the DNA sequence is that diverged at the nucleotide level that a protein sequence search is needed to find putative homologous sequence, usually the genome structure is also very divergent and collinear gene sets are not likely to be found
- Regenerate dotplot images: Select this if you want the dotplot image regenerated. This are saved and can be out of date with regards to the methods used to generate them, or something bad happened during their original generation
- Dotplot axus metric: Are the dotplot axis to be measured in nucleotide or gene units. Nucleotides accurately reflect the structure of the genome. Gene units help make collinear lines straighter if there are regions of the genome undergoing different rates of expansions (e.g. centromeres).
- Master image width: How wide, in pixels, will the master dotplot image be? Dynamic scales it according to the size of the genome, but sometimes it is necessary to make them very large to see some details.
- Calculate substitute rates for syntenic protein coding gene pairs and color syntenic dots accordingly
- This is the option to set if you want to calculate synonymous, nonsynonymous, or the ratio of those and color syntenic gene pair dots based on those values. This is very helpful if there are whole genome duplication events in one or both genomes. When these values are generated, a histogram of the values will also be generated and displayed. The histogram will be color coded identically to the dots in the dotplot. This makes it easy to determine which sytnenic gene pair dots are older or newer than other syntenic dots. PLEASE NOTE: generating these values takes a long time. It takes a very long time for large genomes.
- Order contigs by best syntenic path: this option will invoke a special algorithm to rearrange contigs in order to create the best order of contigs that make a continous syntenic path in relation to a reference genome. This is very useful for a genome sequences that have been assembled to contigs for which a reference genome is available. PLEASE NOTE: that this ordering of contigs may not be how the genome is actually structured. Some genomic changes, such as large-scale inversions will not be correctly placed if the contigs' break-points are at the end of the inversion. This is often the case as inversions happen in repetitive sequence, and these same repetitive sequence are often where genome assembly algorithms cannot assemble through.
Calculating and displaying synonymous/non-synonymous (Ks, Kn) data
This option is selected under the "SynMap Options" tab
To select, just set the option "Calculate substitution rates for syntenic protein coding gene pairs and color syntenic dots accordingly" to what rate you desire:
- Ks -- synonymous
- Kn -- non-synonymous
- Kn/Ks -- ratio of non-synonymous to synonymous changes. This is often used to detected neutral (Kn/Ks == 1), positive (Kn/Ks > 1), and purifying (Kn/Ks < 1) selection acting on a pair of genes.
Synonymous (Ks) and non-synonymous (Kn) site changes are calculated by:
- Performing a global sequence alignment of the protein sequences using the using the Needleman-Wunsch algorithm implemented in nwalign and written and maintained by Brent Pedersen using the BLOSOM62 scoring matrix.
- Back translating the protein sequence into aligned codons
- Using codeml of the PAML software package written and maintained by Ziheng Yang. We modified codeml for implementation in SynMap in order to minimize the number of read/write cycles to the hard drives, as well as allow it to be more easily run in parallel on multi-core servers. For each pairwise comparison of aligned codon sequences, codeml is run 5 times using its default parameter sets, and the lowest Ks is kept.
Running SynMap
Just press "Generate SynMap" when everything is configured. While SynMap runs, messages will be displayed as to the stage of the analysis that is being processed.
Interacting with results
Main results
- Cross-hairs help visually align syntenic region from different parts of the genome.
- Clicking on a chromosome panel in the initial results creates a zoomed-in panel.
Zoomed-in results
- Cross-hairs turn red when the mouse is over a gene pair that is a link to GEvo with that pair pre-loaded. GEvo can then be used to perform a high-resolution analysis of those genomic regions.
Example Results


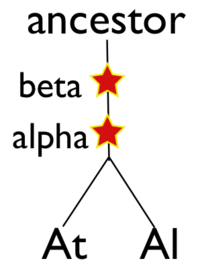
Please refer to the appropriate images for this discussion, or you can regenerate this analysis here. This example shows a whole genome syntenic dotplot comparison of Arabidopsis thaliana (At) and Arabidopsis lyrata (Al). These taxa diverged from one another ~5MYA [1] and share two sequential whole genome duplications events [2] since the divergence of their lineage with Carica papaya's lineage [3]. Each whole genome duplication event creates a contemporaneous copy of every chromosome and all the genetic information they contain. However, over evolutionary time, these duplicated homeologous chromosomes are fractionated, undergo rearrangement and inversions, gene transposition events, and other genomic changes. In addition, duplicated genes that are retained (as well as surrounding non-coding sequence) will diverge from one another. Coding sequence divergence can be measured by synonymous changes (Ks), and a population of contemporaneously created syntenic genes pairs from a whole genome duplication event will create characteristic peaks in a histogram of Ks values [4].
Shared whole genome duplication events can be detected through syntenic dotplot analysis (spacial analysis of gene order) and through synonymous change rate (Ks) histograms (temporal analysis of coding sequence divergence) for putative homologous gene pairs. SynMap can combine these approaches and can identify collinear sets of putatively homologous genes (spatial detection of synteny), calculate Ks values for these syntelogous gene pairs (temporal calculation of synteny), and use those Ks values to generate a color-metric histogram and paint the syntelogs the appropriate color on the dotplot. This combination of temporal and spatial syntenic analysis creates a final image that permits the rapid visual identification and evaluation of shared whole genome duplication events.
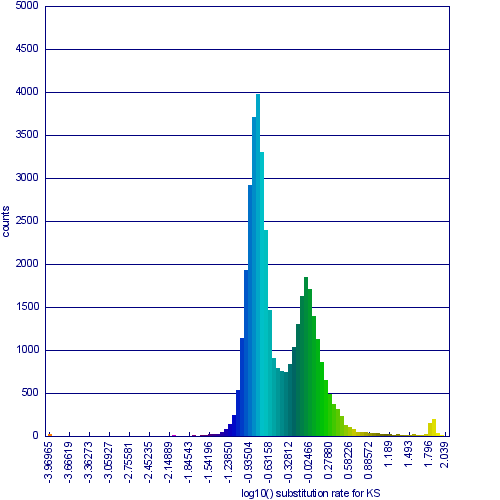
Figure 1a shows a syntenic dotplot between the genomes of At (y-axis) and Al (x-axis) laid on each axis. These plots are generated by comparing every coding sequence between these taxa using blastn in order to identify putatively homologous gene pairs. These results are used by DAGChainer to find collinear sets of genes shared between the taxa. The combined data-set is plotted according to their relative genomic position where each putative homologous gene pair is plotted with a gray dot, and syntenic gene pairs are plotted with a color based on their Ks value. The comparison of At and Al's genomes shows two significant patterns of synteny. First, these two genomes have syntenic regions identified by bright-green lines that are derived from the speciation divergence of these two taxa. Socond, there are smaller blocks of yellow-green lines that are derived from their shared whole genome duplication event (WGD) know as alpha[2]. Comparison to the Ks histogram (Figure 1B) shows that the bright-green has smaller Ks values (fewer changes) than the yellow-green line, which is to be expected as their divergence post-dates their shared whole genome duplication event.
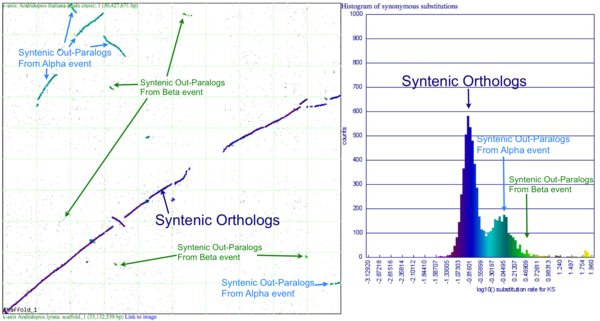
Generating a close-up view of the comparison of chromosome one from both taxa (Figure 2), reveals a similar pattern (light-blue orthologs, light-green out-paralogs derived from their shared most recent whole genome duplication event), with additional evidence of the more ancient shared whole genome duplication event known as beta[2]. The beta whole genome duplication event is visualized by much smaller identified syntenic regions colored in yellow-orange. These syntenic gene-pairs correlate to a smaller peak in the Ks histogram with a larger mean Ks value than the subsequent whole genome duplication even (alpha) or the orthologs derived from the divergence of these taxa.
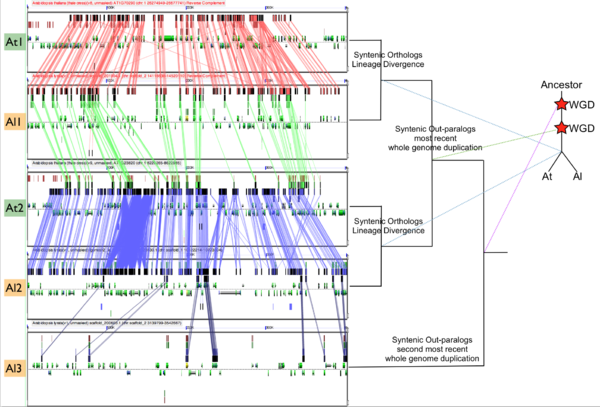
In order to validate and access the types and patterns of change at these genomic loci, high-resolution analysis of these syntenic regions can be performed using GEvo, and selecting the appropriate set of genomic regions using SynMap's interface. Such an analysis can be seen in figure 3 which compares five syntenic regions from these taxa. Two pairs of regions, At1-Al1 and At2-Al2, are orthologous and derived from the speciation of these lineages. This is evidenced by the high degree of spatial evidence for synteny between these regions (pink and blue lines) where nearly every gene in these regions has an orthologous partner in a collinear arrangement. These two pairs of regions are also syntenic with respect to one another (green lines) and are derived from their shared most recent whole genome duplication event (WGD) known as alpha. These four regions are syntenic to an additional region, Al3, which is derived from these lineages' shared second most recent whole genome duplication event known as beta. Syntenic genes are connected between Al2 and Al3 using dark blue lines, and note the lower density of syntenic gene pairs than for regions derived from the most recent WGD and the speciation of the lineages. While not shown in this figure, there is a syntenic region in At to Al3 from the speciation of these taxa, and two addition syntenic regions (one from each lineage) derived from the alpha whole genome duplication.
Please note that the Ks histogram is using log10 transformed Ks values. While many people set an upper cutoff for Ks values (usually at 2), these histograms show all values. The peak in the both these Ks histograms (Mean Ks ~ 65) at the far right and colored red is the result from mis-called syntenic gene pairs, genes whose alignments are very poor (e.g. due to a frame-shift mutation or pseudogenization), or from an error in the Ks calculation.
- ↑ Lysak MA, Berr A, Pecinka A, Schmidt R, McBreen K, Schubert I. Mechanisms of chromosome number reduction in Arabidopsis thaliana and related Brassicaceae species. Proceedings of the National Academy of Sciences of the United States of America. 2006 Mar 28;103(13):5224-5229.
- ↑ 2.0 2.1 2.2 Bowers JE, Chapman BA, Rong JK, Paterson AH. Unravelling angiosperm genome evolution by phylogenetic analysis of chromosomal duplication events. Nature. 2003;422:433–438.
- ↑ Ming R, Hou S, Feng Y, Yu Q, Dionne-Laporte A, Saw JH, Senin P, Wang W, Ly BV, Lewis KL, et al. The draft genome of the transgenic tropical fruit tree papaya (Carica papaya Linnaeus). Nature. 2008;452:991–996. doi: 10.1038/nature06856.
- ↑ Blanc, G., and K. H. Wolfe. 2004. Widespread paleopolyploidy in model plant species inferred from age distributions of duplicate genes. Plant Cell 16:1667-1678