GenomeView examples: Difference between revisions
Jump to navigation
Jump to search
No edit summary |
No edit summary |
||
| Line 1: | Line 1: | ||
===Overview=== | |||
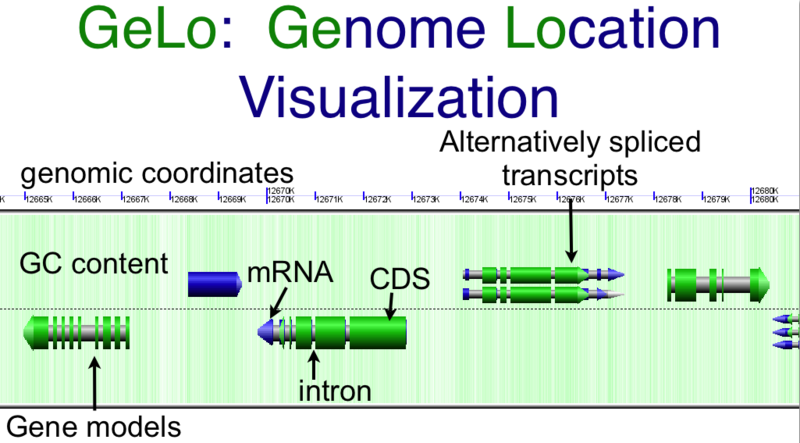
[[Image:GeLo-example.png|thumb|800px|left|Overview of [[GenomeView]]'s visualization using the [[GeLo]] genomic visualization library. Background of chromosome is colored green for GC rich regions and while for AT rich regions. Gene models are drawn as composite colored arrows such that gray is the extent of the gene, blue is mRNA, and green is protein coding [[CDS]] sequence. Overlapping genomic features are detected and expanded to show alternatively spiced transcripts]] | [[Image:GeLo-example.png|thumb|800px|left|Overview of [[GenomeView]]'s visualization using the [[GeLo]] genomic visualization library. Background of chromosome is colored green for GC rich regions and while for AT rich regions. Gene models are drawn as composite colored arrows such that gray is the extent of the gene, blue is mRNA, and green is protein coding [[CDS]] sequence. Overlapping genomic features are detected and expanded to show alternatively spiced transcripts]] | ||
[[Image:GenomeView-background.png|thumb|800px|left|Background of chromosome colored green to show GC rich regions and white to show AT rich regions]] | [[Image:GenomeView-background.png|thumb|800px|left|Background of chromosome colored green to show GC rich regions and white to show AT rich regions]] | ||
[[Image:GeLo-nucleotides.png|thumb|left|800px|Example GeLo graphics using images of nucleotides in the background. These are also colored green for GC and white for AT]] | |||
[[Image:GenomeView-gene.png|thumb|800px|left|Gene models drawn as gray arrows]] | [[Image:GenomeView-gene.png|thumb|800px|left|Gene models drawn as gray arrows]] | ||
[[Image:GenomeView-mRNA.png|thumb|800px|left|mRNA drawn as blue arrows (on top of gray genes)]] | [[Image:GenomeView-mRNA.png|thumb|800px|left|mRNA drawn as blue arrows (on top of gray genes)]] | ||
Revision as of 19:28, 5 February 2010
Overview


