Syntenic dotplot of peach versus grape: Difference between revisions
Jump to navigation
Jump to search
Created page with 'thumb|right|600px|' |
No edit summary |
||
| Line 1: | Line 1: | ||
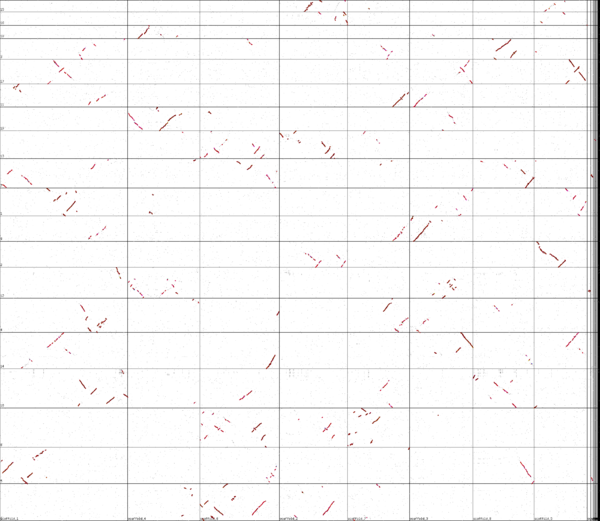
[[Image:Syntenic dotplot Prunus persica peach versus Vitis vinifera grapevine.png|thumb|right|600px|]] | [[Image:Syntenic dotplot Prunus persica peach versus Vitis vinifera grapevine.png|thumb|right|600px|Syntenic dotplot of Prunus persica (peach; x-axis) and Vitis vinifera (grapevine; y-axis). Results can be regenerated at http://genomevolution.org/CoGe/SynMap.pl?dsgid1=8400;dsgid2=43;c=4;D=20;g=10;A=5;Dm=0;gm=;w=0;b=1;ft1=1;ft2=1;ma=1;do1=1;do2=1;do=40;dt=geneorder;ks=1;am=g]] | ||
Whole genome syntenic comparison of peach tree's genome to grapevine's shows extensive synteny where each region of each genome matching one other region very well, and two other regions less well. | |||
Revision as of 01:05, 10 April 2010

Whole genome syntenic comparison of peach tree's genome to grapevine's shows extensive synteny where each region of each genome matching one other region very well, and two other regions less well.