Cacao syntenic dotplots: Difference between revisions
Jump to navigation
Jump to search
No edit summary |
mNo edit summary |
||
| Line 1: | Line 1: | ||
[[Image:Master 8400 10997.CDS-genomic.lastz.dag.go c4 D20 g10 A5.aligncoords.gcoords ct0.w2000.cs1.nsd.png|800px|thumb|right|Syntenic dotplot using [[SynMap]] of Cacao (y-axis) versus Peach (x-axis). Results can be regenerated at http://genomevolution.org/r/2h98]] | [[Image:Master 8400 10997.CDS-genomic.lastz.dag.go c4 D20 g10 A5.aligncoords.gcoords ct0.w2000.cs1.nsd.png|800px|thumb|right|Syntenic dotplot using [[SynMap]] of Cacao (y-axis) versus Peach (x-axis). Results can be regenerated at http://genomevolution.org/r/2h98]] | ||
[[Image:Master 8400 10997.CDS-genomic.lastz.dag.go c4 D20 g10 A5.aligncoords.gcoords ct0.w2000.cs1.png|800px|thumb|right|Syntenic dotplot using [[SynMap]] of Cacao (y-axis) versus Peach (x-axis). Green are syntenic matches, gray is any match. Results can be regenerated at http://genomevolution.org/r/2h9j]] | [[Image:Master 8400 10997.CDS-genomic.lastz.dag.go c4 D20 g10 A5.aligncoords.gcoords ct0.w2000.cs1.png|800px|thumb|right|Syntenic dotplot using [[SynMap]] of Cacao (y-axis) versus Peach (x-axis). Green are syntenic matches, gray is any match. Results can be regenerated at http://genomevolution.org/r/2h9j]] | ||
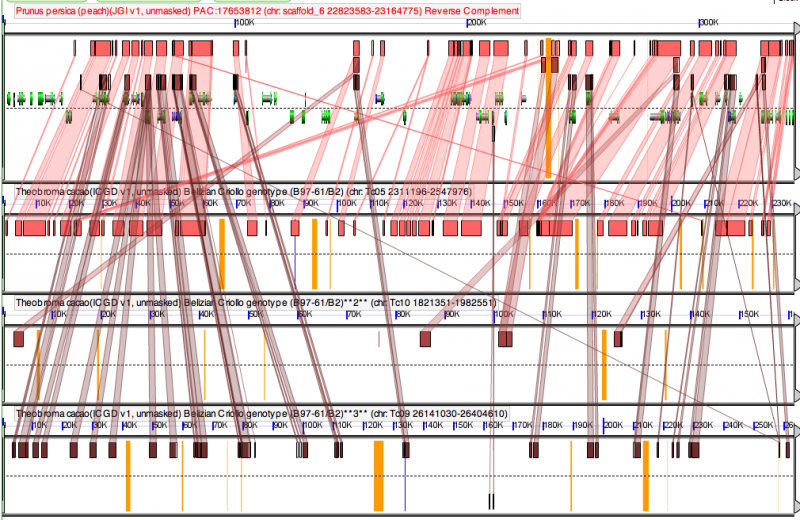
[[Image:Screen shot 2011-01-26 at 9.48.16 AM.png|800px|thumb|right|High-resolution sequence analysis using [[GEvo]] of orthologous syntenic regions between cacao and peach, with two additional cacao syntenic regions derived from the | [[Image:Screen shot 2011-01-26 at 9.48.16 AM.png|800px|thumb|right|High-resolution sequence analysis using [[GEvo]] of orthologous syntenic regions between cacao and peach, with two additional cacao syntenic regions derived from the [[eudicot paleohexaploidy]]. (Top: peach; bottom three: cacao.) Results can be regenerated at: http://genomevolution.org/r/2h9t]] | ||
==Syntenic dotplot between Cacao and Peach genomes== | ==Syntenic dotplot between Cacao and Peach genomes== | ||
| Line 7: | Line 7: | ||
==High-resolution syntenic analysis of Cacao and Peach genomes== | ==High-resolution syntenic analysis of Cacao and Peach genomes== | ||
The [[GEvo]] analysis of sytnenic regions between cacao and peach (top pannel) shows that one cacao region is highly syntenic to a peach region. These regions are derived from the divergence of the peach and cacao lineages. The other two syntenic cacao regions show much weaker synteny (fewer collinear homologous regions). These regions are derived from the [[ | The [[GEvo]] analysis of sytnenic regions between cacao and peach (top pannel) shows that one cacao region is highly syntenic to a peach region. These regions are derived from the divergence of the peach and cacao lineages. The other two syntenic cacao regions show much weaker synteny (fewer collinear homologous regions). These regions are derived from the [[eudicot paleohexaploidy]]. | ||
Revision as of 16:36, 26 January 2011


Syntenic dotplot between Cacao and Peach genomes
The syntenic dotplot shows a strong 1:1 mapping of syntenic regions, and weaker 3:3 mappings of syntenic regions. This is due to the shared paleohexaploidy event at the base of the eudicots and the lack of subsequent whole genome duplications events in either lineage.
High-resolution syntenic analysis of Cacao and Peach genomes
The GEvo analysis of sytnenic regions between cacao and peach (top pannel) shows that one cacao region is highly syntenic to a peach region. These regions are derived from the divergence of the peach and cacao lineages. The other two syntenic cacao regions show much weaker synteny (fewer collinear homologous regions). These regions are derived from the eudicot paleohexaploidy.