Genomic Rearrangement Analysis: Difference between revisions
Jump to navigation
Jump to search
No edit summary |
No edit summary |
||
| Line 1: | Line 1: | ||
Using CoGe to help with Genomic Rearragement Analyses is quite simple: | |||
*Pre-configured [[SynMap]] example: http://genomevolution.org/r/2nd9 | |||
# Go to [[SynMap]] | |||
# Select two genomes | |||
# Select the "Analysis Options" tab | |||
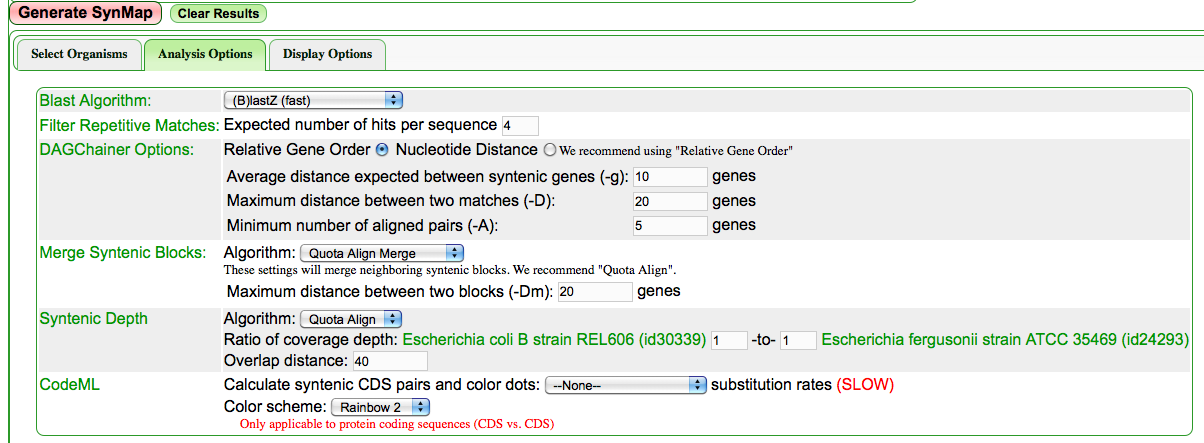
# Optional: Set the "Merge Syntenic Blocks" algorithm to [[Quota align] and set some number of allowable overlapping genes (10-20 works well for microbes, select 80 for large animal and plant genomes) | |||
# Set the "Syntenic Depth" algorithm to [[Quota align]] and have the ratio of syntenic depth set to 1:1 | |||
# Run SynMap | |||
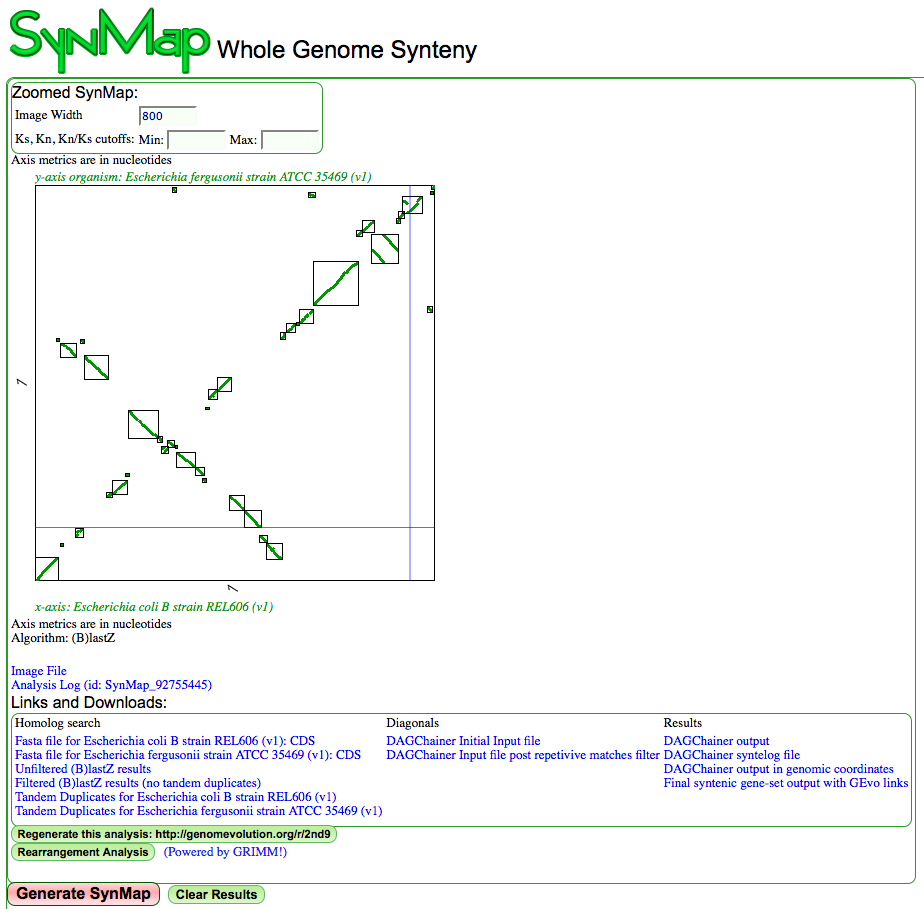
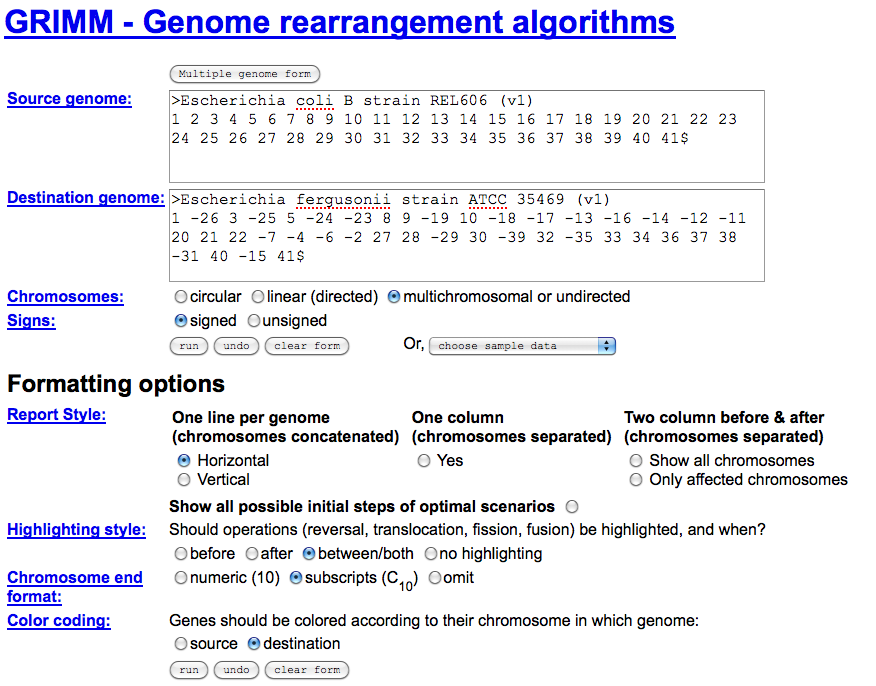
# Use the link "Rearrangement Analysis" located under the "Links and Downloads". This will take you to [http://grimm.ucsd.edu/GRIMM/ GRIMM] for the genomic rearrangement analysis | |||
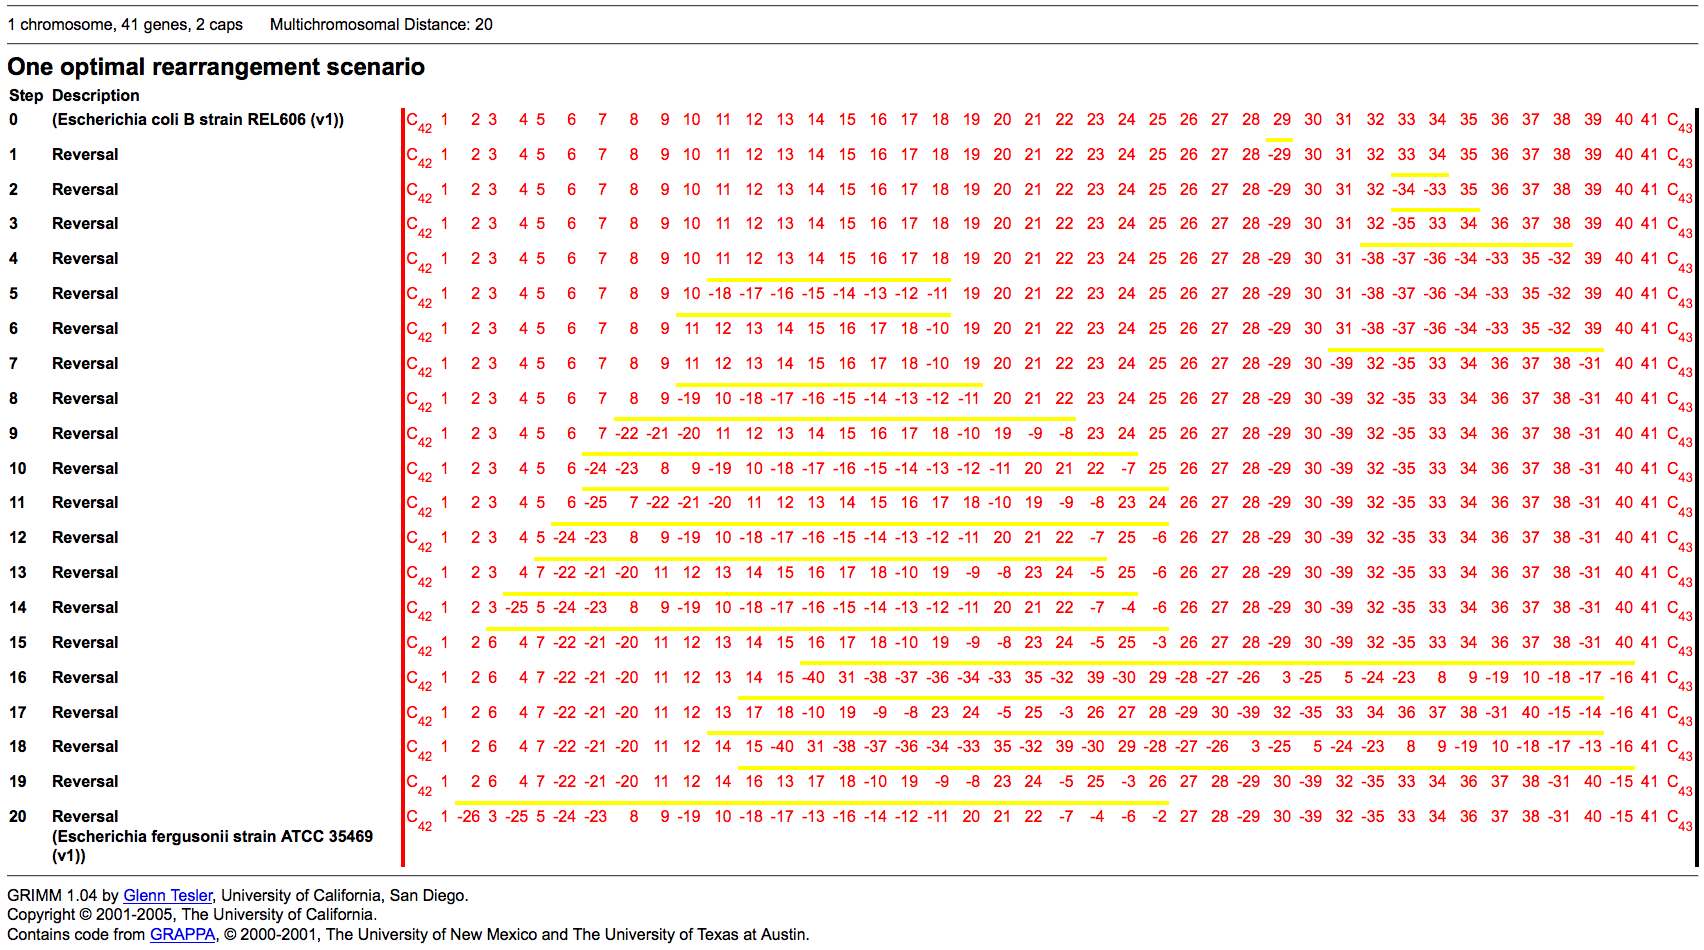
# Run GRIMM | |||
[[Image:Screen shot 2011-03-11 at 7.58.21 AM.png|frame|left|Configuring a [[SynMap]] analysis to use [[Quota align]] with a syntenic depth of 1:1.]] | [[Image:Screen shot 2011-03-11 at 7.58.21 AM.png|frame|left|Configuring a [[SynMap]] analysis to use [[Quota align]] with a syntenic depth of 1:1.]] | ||
Revision as of 14:04, 11 March 2011
Using CoGe to help with Genomic Rearragement Analyses is quite simple:
- Pre-configured SynMap example: http://genomevolution.org/r/2nd9
- Go to SynMap
- Select two genomes
- Select the "Analysis Options" tab
- Optional: Set the "Merge Syntenic Blocks" algorithm to [[Quota align] and set some number of allowable overlapping genes (10-20 works well for microbes, select 80 for large animal and plant genomes)
- Set the "Syntenic Depth" algorithm to Quota align and have the ratio of syntenic depth set to 1:1
- Run SynMap
- Use the link "Rearrangement Analysis" located under the "Links and Downloads". This will take you to GRIMM for the genomic rearrangement analysis
- Run GRIMM


