Inversion: Difference between revisions
Jump to navigation
Jump to search
No edit summary |
No edit summary |
||
| Line 4: | Line 4: | ||
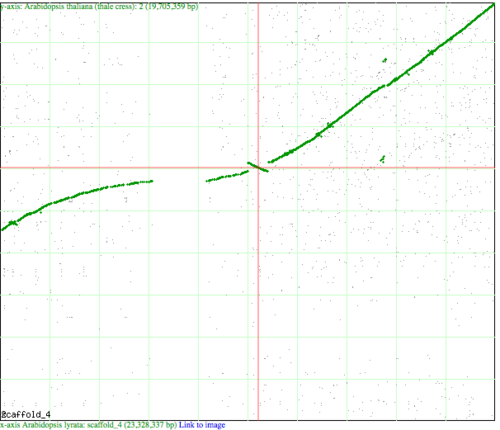
An inversion happens when a genomic region flips its orientation in a genome such that the 5' and 3' ends change places. There are several ways to visualize a genomic inversion. The two images at the right use CoGe to visualize an inversion. The top image is a syntenic dotplot between | An inversion happens when a genomic region flips its orientation in a genome such that the 5' and 3' ends change places. There are several ways to visualize a genomic inversion. The two images at the right use CoGe to visualize an inversion. The top image is a syntenic dotplot visualized by SynMap between chromosome 4 of Arabidopsis lyrata (x-axis) and chromosome 2 of Arabidopsis thaliana (y-axis). Green dots represent syntenic genes as identified by DAGChainer. Note the inversion at the center of the cross hairs where the green "line" changes slope from positive to negative. The second image is a GEvo analysis of the inversion detected in the SynMap image. | ||
Revision as of 18:35, 21 July 2009


An inversion happens when a genomic region flips its orientation in a genome such that the 5' and 3' ends change places. There are several ways to visualize a genomic inversion. The two images at the right use CoGe to visualize an inversion. The top image is a syntenic dotplot visualized by SynMap between chromosome 4 of Arabidopsis lyrata (x-axis) and chromosome 2 of Arabidopsis thaliana (y-axis). Green dots represent syntenic genes as identified by DAGChainer. Note the inversion at the center of the cross hairs where the green "line" changes slope from positive to negative. The second image is a GEvo analysis of the inversion detected in the SynMap image.