Exporting GEvo results for publication: Difference between revisions
Created page with 'For GEvo, there are two general ways to reconstruct the image for use in a graphics editor program: #Screenshots #Download individual genomic region graphics ==Screenshots== Wh...' |
No edit summary |
||
| Line 6: | Line 6: | ||
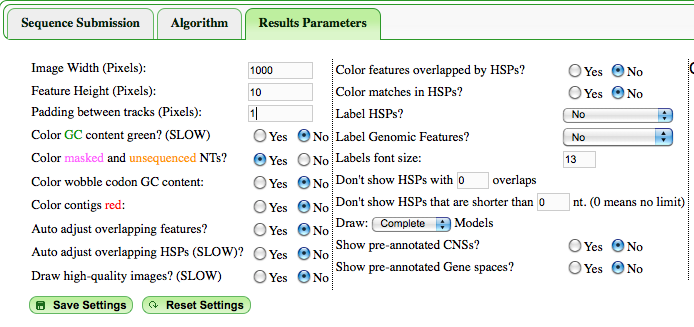
When comparing many regions (e.g. six), you can try to get them to all fit on your screen by adjusting the "Feature Height" and "Padding between tracks" (both found under the "Results Parameters" tab; see attached screen shot). | When comparing many regions (e.g. six), you can try to get them to all fit on your screen by adjusting the "Feature Height" and "Padding between tracks" (both found under the "Results Parameters" tab; see attached screen shot). | ||
[[Image:Screen shot 2011-10-28 at 6.32.27 AM.png|thumb|center|800px|Screenshot from GEvo showing some of the options for adjusting the resulting images.]] | |||
This will shrink the overall height of each viewed GEvo panel. You can also select one of the regions to be the "Reference Sequence", to which all the other regions will be compared (found under "Sequence X Options" in each sequence submission box). Otherwise, what I do is to take multiple screen shots for different regions of the results and align them on top of one another in a graphics editor. | This will shrink the overall height of each viewed GEvo panel. You can also select one of the regions to be the "Reference Sequence", to which all the other regions will be compared (found under "Sequence X Options" in each sequence submission box). Otherwise, what I do is to take multiple screen shots for different regions of the results and align them on top of one another in a graphics editor. | ||
Revision as of 15:21, 22 November 2011
For GEvo, there are two general ways to reconstruct the image for use in a graphics editor program:
- Screenshots
- Download individual genomic region graphics
Screenshots
When comparing many regions (e.g. six), you can try to get them to all fit on your screen by adjusting the "Feature Height" and "Padding between tracks" (both found under the "Results Parameters" tab; see attached screen shot).

This will shrink the overall height of each viewed GEvo panel. You can also select one of the regions to be the "Reference Sequence", to which all the other regions will be compared (found under "Sequence X Options" in each sequence submission box). Otherwise, what I do is to take multiple screen shots for different regions of the results and align them on top of one another in a graphics editor.
If you need very high resolution images, you can adjust the "Image Width" and "Feature Height" (under the "Results Parameters" tab) to be large, and the results have links to the actual PNGs generated under the heading "Image Files" in the area where all the raw data and GEvo links are displayed (under the graphical results). The problem with these images is that you will have to manually draw lines connecting regions of sequence similarity using a graphics editor.
For SynMap, there is a link to the image used in the dotplot. That link, "Image File", is located under the dotplot and above the "Links and Downloads" section.
I hope that helps, but if you would like some more help, let's set up a Skype call today or next week and I can work through this with you online.