GenomeView: Difference between revisions
No edit summary |
No edit summary |
||
| Line 1: | Line 1: | ||
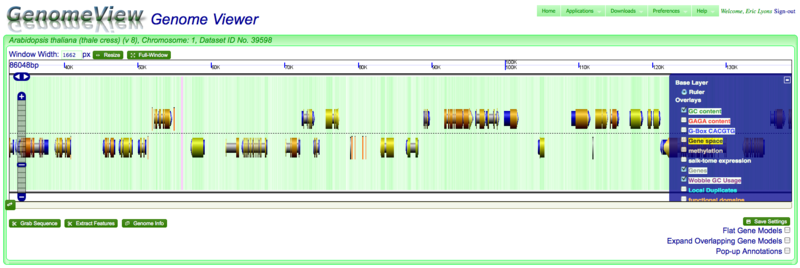
[[Image:GenomeView.png|thumb| | [[Image:GenomeView.png|thumb|right|800px|Interface to GenomeView]] | ||
=Navigation= | =Navigation= | ||
Revision as of 18:15, 11 August 2009

Panning left-right
Click and drag with mouse
Using the left/right arrows
Using scroll bar below graphics
Zooming in and out
Double-clicking on a region
Using the mouse scroll-wheel
Changing displayed information
Getting additional information and data=
Annotations
Full Annotations
===Popup-annotations
Grab Sequence
Extract Genomic Features
Other options
Flat Gene Models
Expand Gene Models
Understanding the image


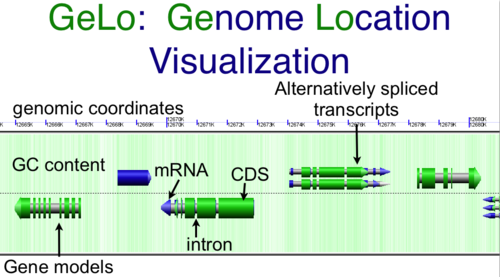
CoGe's genomic visualization library, GeLo, permits the creation of a virtual chromosome using any style of glyphs to represent genomic information. Below are the common implementations used in CoGe
Genomic Features
Genomic features are usually drawn as arrows or blocks of varying size and color. While there is some variation in how such features are drawn due to difference in how they were specified in the original data source (e.g. do mRNAs include introns?), the general conventions used in CoGe are:
- Grey (narrow): Gene. Usually starting at the beginning of the transcript, stopping at the end of the transcript, and including all intronic sequence, if appropriate.
- blue: mRNA transcript
- Green: CDS/protein coding regions (Please see note below)
- grey (large): RNA gene (tRNA, rRNA, etc.)
- orange-red: pseudogene
- purple: masked sequenced (X). Masked genomes are generated often to remove repetitive sequence.
Note: There are options in CoGe to color protein coding regions (CDS) based on the GC content of the wobble position in the codon. If this visualization is use, a color gradient is used to depict the wobble GC content such that:
- red: AT rich in CDS wobble positions
- green: GC rich in CDS wobble positions
- yellow: 50%/50% AT/GC in CDS wobble positions
Background of virtual chromosome
The background of a genomic image can also be colored. Most often, this is used to color the genomic GC content such that:
- green: GC rich
- white: AT rich
- orange: Unsequenced (N)
Expanding overlapping genomic features
When genomic features overlap, as happens with alternatively spliced transcripts, you often have the option of drawn these on top of one another, or have CoGe detect this and drawn them above and below one another.