SynMap: Difference between revisions
Jump to navigation
Jump to search
| Line 17: | Line 17: | ||
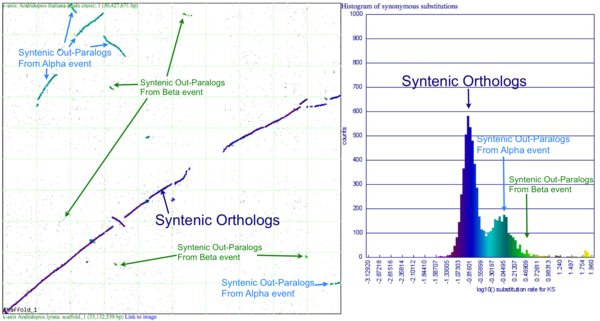
[[Image:SynPlot-Chr1-At-v-Al.png|thumb|right|600px|Syntenic dotplot and synonymous substitution histogram of Chromosome 1 of Arabidopsis thaliana and Arabidopsis lyrata. Syntenic gene pairs were identified by DAGChainer, and colored based on their synonymous substitution rate as calculated by CodeML. Syntenic regions derived from speciation (orthologs) or from the shared whole genome duplication events (alpha and beta) are labeled. These images were generated by SynMap and can be viewed at generated by SynMap at http://toxic.berkeley.edu/CoGe//diags/Arabidopsis_lyrata/Arabidopsis_thaliana_thale_cress/html/3068_8.CDS-CDS.blastn.dag_geneorder_D20_g10_A5.scaffold_1-1.w600.ks.html]] | [[Image:SynPlot-Chr1-At-v-Al.png|thumb|right|600px|Syntenic dotplot and synonymous substitution histogram of Chromosome 1 of Arabidopsis thaliana and Arabidopsis lyrata. Syntenic gene pairs were identified by DAGChainer, and colored based on their synonymous substitution rate as calculated by CodeML. Syntenic regions derived from speciation (orthologs) or from the shared whole genome duplication events (alpha and beta) are labeled. These images were generated by SynMap and can be viewed at generated by SynMap at http://toxic.berkeley.edu/CoGe//diags/Arabidopsis_lyrata/Arabidopsis_thaliana_thale_cress/html/3068_8.CDS-CDS.blastn.dag_geneorder_D20_g10_A5.scaffold_1-1.w600.ks.html]] | ||
This example shows a whole genome syntenic dotplot comparison of ''Arabidopsis thaliana'' (At) and ''Arabidopsis lyrata'' (Al). These taxa diverged from one another ~5MYA | |||
Revision as of 16:53, 28 August 2009
Overview
Specifying genomes
DAGChainer options
SynMap options
Calculating and displaying synonymous/non-synonymous (kS, kN) data
Interacting with results
Example Results


This example shows a whole genome syntenic dotplot comparison of Arabidopsis thaliana (At) and Arabidopsis lyrata (Al). These taxa diverged from one another ~5MYA