GenomeView: Difference between revisions
No edit summary |
No edit summary |
||
| Line 100: | Line 100: | ||
=Examples= | =Examples= | ||
===Identifying Horizontal Gene Transfer using GC content in wobble position coloring=== | ===Identifying Horizontal Gene Transfer using GC content in wobble position coloring=== | ||
[[Image:K12-HGT.png|thumb|left|600px]] | |||
A cryptic prophage is easily visualized in the genome of Escherichia coli K12 substrain MG1655 by adding the visualization layer for coloring coding sequence by the percent GC in their wobble positions. While the majority of coding sequence in K12 have a yellow-green color (showing a GC content slightly greater than 50%), the phage's coding sequence is heavily biased towards a high AT content in the wobble position. This results in its coding sequence being colored red. This is further seen by turning on the "Other Feature" visualization layer where a misc_feature that annotates the prophage is shown by a large orange block. This view can be recreated at: http://synteny.cnr.berkeley.edu/CoGe/GenomeView.pl?z=5&x=570000&dsgid=4242&chr=1&dsid=36725&gstid=1 | |||
Revision as of 17:58, 16 September 2009
Panning left-right
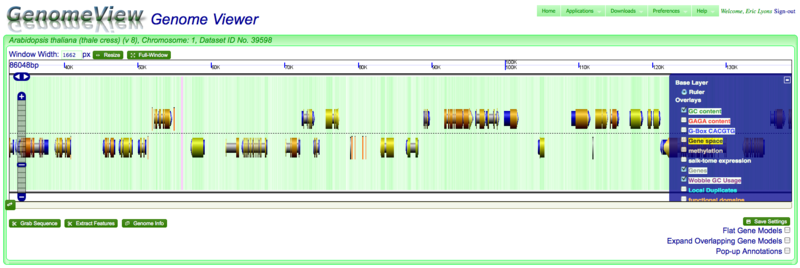
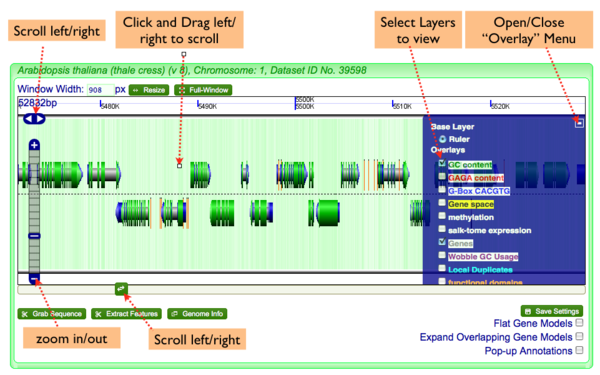
There are several ways to move along a genomic region:
- Click on the chromosome and drag with mouse
- Use the left/right arrows located on the left of the viewer
- Use scroll bar below graphics by clicking and dragging, or clicking somewhere in the bar
Zooming in and out
You can zoom into and out of a genomic region by:
- Using navigation menu on the left of the viewer. (+) zooms in, (-) zooms out, and the tick-marks take you a specific zoom level.
- Double-clicking on a region will zoom in one level
- Use the mouse scroll-wheel to zoom in and out if the mouse pointer is over the chromosome
Changing displayed information
There are often many types of genomic information that can be displayed as overlays. To toggle various overlays, open the overlay menu by clicking on the "+" symbol in the top right corner of the viewer and select the overlays you wish to view.
Getting additional information and data
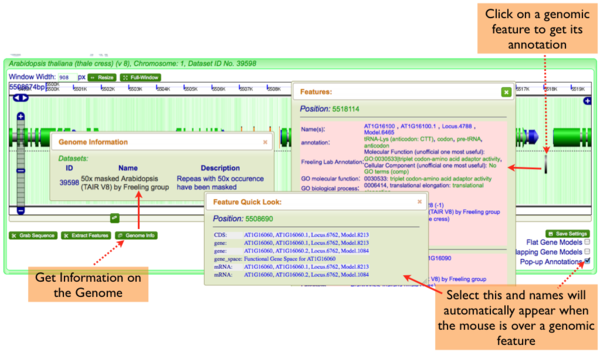
GenomeView has several ways to get information:
Annotations
- Full Genomic Feature Annotations: Simply click on a feature, and a window will appear with the complete annotation for all features at that location. This window is resizeable and draggable.
- Popup-annotations: Select the "Pop-up Annotations" in the lower right hand part of the navigation screen, and the names of genomic features will pop-up when the mouse pointer hovers over them for a second. This window is resizable and draggable.
- Genome Information: Click on the "Genome Info" button in the lower left hand part of the navigation screen and an overview of the genome will pop-up.
Note: many of the annotations contain links to other parts of CoGe. For example, if you want to get the sequence of a feature, just click on its location information in the pop-up annotation window.
Grab Sequence
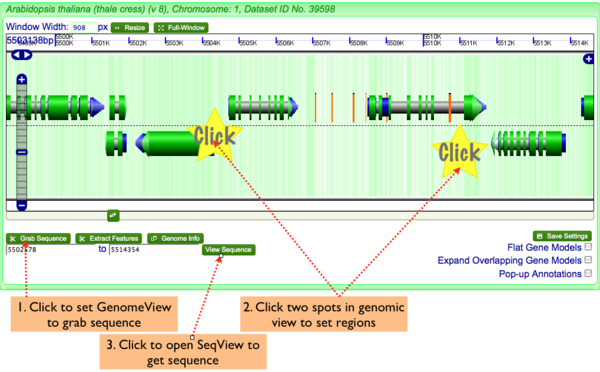
To get genomic sequence in fasta format:
- Click "Grab Sequence" button in lower left of navigation screen.
- Click two regions in the genomic view to set the start and stop positions of the sequence you wish to grab
- Click "View Sequence" to launch SeqView and get the sequence of the selected region in fasta format
Extract Genomic Features
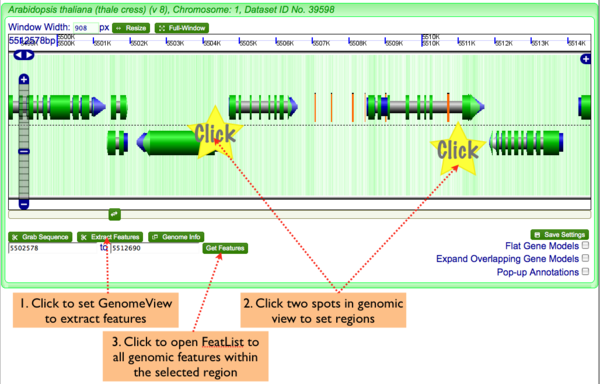
To genomic features:
- Click "Extract Features" button in lower left of navigation screen.
- Click two regions in the genomic view to set the start and stop positions of the sequence you wish to grab
- Click "Get Features" to launch FeatList and get a list of all genomic features in the selected region
Understanding the image


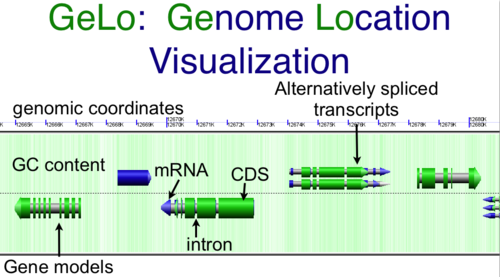


CoGe's genomic visualization library, GeLo, permits the creation of a virtual chromosome using any style of glyphs to represent genomic information. Below are the common implementations used in CoGe
Genomic Features
Genomic features are usually drawn as arrows or blocks of varying size and color. While there is some variation in how such features are drawn due to difference in how they were specified in the original data source (e.g. do mRNAs include introns?), the general conventions used in CoGe are:
- Grey (narrow): Gene. Usually starting at the beginning of the transcript, stopping at the end of the transcript, and including all intronic sequence, if appropriate.
- blue: mRNA transcript
- Green: CDS/protein coding regions (Please see note below)
- grey (large): RNA gene (tRNA, rRNA, etc.)
- orange-red: pseudogene
Note: There are options in CoGe to color protein coding regions (CDS) based on the GC content of the wobble position in the codon. If this visualization is use, a color gradient is used to depict the wobble GC content such that:
- red: AT rich in CDS wobble positions
- green: GC rich in CDS wobble positions
- yellow: 50%/50% AT/GC in CDS wobble positions
Background of virtual chromosome
The background of a genomic image can also be colored. Most often, this is used to color the genomic GC content such that:
- green: GC rich
- white: AT rich
- orange: Unsequenced (N)
- purple: masked sequenced (X). Masked genomes are generated often to remove repetitive sequence.
Expanding overlapping genomic features
When genomic features overlap, as happens with alternatively spliced transcripts, you often have the option of drawn these on top of one another, or have CoGe detect this and drawn them above and below one another.
- Select "Expand Overlapping Gene Models" in the lower right of the screen to turn this on
Other options
Flat Gene Models
Flat gene models are simple arrows without the "tubular" design. This was the original way gene models were drawn before Josh Kane updated the model.
Expand Gene Models
Separates genomic features that overlap at the same genomic position. Usually happens when alternatively spliced transcripts are annotated.
Save Settings
Registered users can save which information they want to see by default as well as how gene models are drawn"
Window Width
Sets the size of the window used for navigating a genomic region. Options in the top-left of navigation window
- Resize: sets the navigation window to the size specified in the "Window Width" box (in pixels)
- Full Screen: sets the navigation window to the size of the browser window
Examples
Identifying Horizontal Gene Transfer using GC content in wobble position coloring
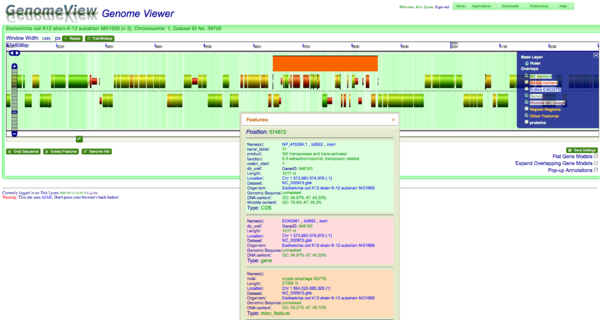
A cryptic prophage is easily visualized in the genome of Escherichia coli K12 substrain MG1655 by adding the visualization layer for coloring coding sequence by the percent GC in their wobble positions. While the majority of coding sequence in K12 have a yellow-green color (showing a GC content slightly greater than 50%), the phage's coding sequence is heavily biased towards a high AT content in the wobble position. This results in its coding sequence being colored red. This is further seen by turning on the "Other Feature" visualization layer where a misc_feature that annotates the prophage is shown by a large orange block. This view can be recreated at: http://synteny.cnr.berkeley.edu/CoGe/GenomeView.pl?z=5&x=570000&dsgid=4242&chr=1&dsid=36725&gstid=1