FractBias: Difference between revisions
| Line 19: | Line 19: | ||
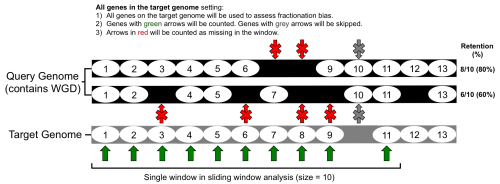
[[File:fractbiasfigure_allgenes.png|right| | [[File:fractbiasfigure_allgenes.png|right|thumb|500px|caption]] | ||
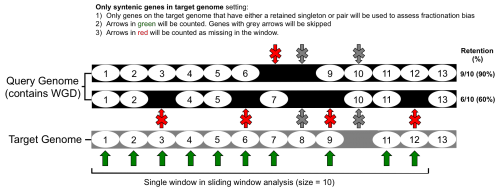
[[File:fractbiasfigure_oneretained.png|right| | [[File:fractbiasfigure_oneretained.png|right|thumb|500px|caption]] | ||
===FractBias tool analysis=== | ===FractBias tool analysis=== | ||
Revision as of 21:09, 5 October 2015
Background
Whole genome duplications (WGDs) and genome fractionation are covered more thoroughly in other CoGepedia entries. In short, WGDs create two or more copies of a genome: which are referred to as subgenomes. The duplicate subgenomes then undergo gene loss in a process called fractionation which is part of returning to a diploid state, diploidization. All things being equal, one may assume that fractionation would occur randomly across the redundant genes created after a WGD, however bias towards gene loss on one genome, called fractionation bias, has been observed in several species including: maize [1], Brassica rapa [2], .
Overview
What goes in
- Two assembled genomes that have annotated coding sequences (CDS)
- A syntenic ratio set by the user (identified by empiric tests outside of the FractBias tool)
- The full GFF of the target
What comes out
FractBias Methods
FractBias is a tool used to assess fractionation bias between genomes. This is accomplished by:
User Input
- Select two genomes to compare in the SynMap tool.
- Select the SynMap 'Syntenic Depth' option under 'Analysis Options.'
- Set syntenic depth ratio between genomes (determined by empirically outside of this tool).


FractBias tool analysis
- The coordinates for syntenic regions between the genomes are determined by the SynMap tool
- The syntenic genes are then parsed according to the 'target' and 'query' genomes. The genome with the lower syntenic depth ratio is set as the target genome; the genome with the higher ratio is set as the query genome.
- A list of genes present on every target genome chromosome is made and ordered according to start site (bp) in the annotation (gff/gtf file).
- The FractBias tool then goes through the list of each target genome gene, and determines if it has a syntenic pair on one (or more) of the query chromosomes.
- Finally, the FractBias tool runs a sliding window analysis to calculate how many genes are retained for each query chromosome.
- A figure is generated that contains a subplot for every target genome chromosome
- The x-axis: target genome gene order number in sliding window according to order of start site in genome annotation (gff/gtf).
- The y-axis:
Example Data
Sorghum and Maize Fractionation Bias
Arabidopsis and Brassica Fractionation Bias
Esox and Oncorhynchus Fractionation Bias
References
- ↑ Schnable, J.C. et al. Dose–sensitivity, conserved non-coding sequences, and duplicate gene retention through multiple tetraploidies in the grasses. Front. Plant Sci. http://dx.doi.org/10.3389/fpls.2011.00002 (2011)
- ↑ Cheng, F. et al. Biased gene fractionation and dominant gene expression among the subgenomes of Brassica rapa. PLOS ONE DOI: 10.1371/journal.pone.0036442 (2012)