Popgen: Difference between revisions
Jump to navigation
Jump to search
mNo edit summary |
|||
| Line 2: | Line 2: | ||
== Summary Statistics == | == Summary Statistics == | ||
These summary statistics are computed per feature overall (gene, CDS, etc) and by 0/4-fold degeneracy (for CDS only): | |||
* Nucleotide diversity (pi) - average number of pairwise differences between variant sequences | * Nucleotide diversity (pi) - average number of pairwise differences between variant sequences | ||
* Watterson's estimator (theta) | * Watterson's estimator (theta) | ||
Revision as of 17:49, 1 March 2016
CoGe can generate basic population genetics summary statistics given a GVCF input file and an annotated genome.
Summary Statistics
These summary statistics are computed per feature overall (gene, CDS, etc) and by 0/4-fold degeneracy (for CDS only):
- Nucleotide diversity (pi) - average number of pairwise differences between variant sequences
- Watterson's estimator (theta)
- Tajima's D
Steps
1. Load a GVCF file
See the LoadExperiment tool to load a GCVF file against an existing genome in CoGe.
2. Analyze Diversity
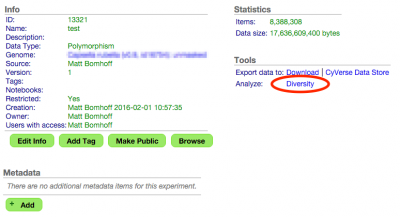
In the resulting experiment's menu select "Analyze Diversity".
3. Open the finished result
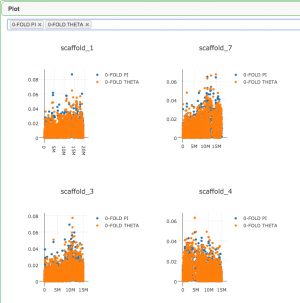
Open the result in the PopGen tool to see results in tabular and graphical form.


