Plasmodia comparative genomics: Difference between revisions
No edit summary |
No edit summary |
||
| Line 6: | Line 6: | ||
[[Image:Plasmodium-codon-substitution-matirx.png|thumb|right|600px|Log-odds score substitution matrix of codons between Plasmodium falciparum (x-axis) and Plasmodium knowlesi (y-axis). P. falciparum is a low-GC genome and P. kowlesi is a mid-GC genome.]] | [[Image:Plasmodium-codon-substitution-matirx.png|thumb|right|600px|Log-odds score substitution matrix of codons between Plasmodium falciparum (x-axis) and Plasmodium knowlesi (y-axis). P. falciparum is a low-GC genome and P. kowlesi is a mid-GC genome.]] | ||
=Abstract= | |||
The genomes of two Plasmodium species, falciparum and knowlesi are structurally very similar to one another: | The genomes of two Plasmodium species, falciparum and knowlesi are structurally very similar to one another: | ||
Revision as of 01:16, 10 February 2017


Abstract
The genomes of two Plasmodium species, falciparum and knowlesi are structurally very similar to one another:
| Organism | Chromosome count | Genome Length | CDS count | Genome GC content | CDS GC content | CDS Wobble position content | non-coding GC content |
| Plasmodium falicparum | 14 | 22,860,235 bp | 5267 | 19.88% | 23.72% | 17.30% | 14.58% |
| Plasmodium knowlesi | 14 | 23,462,187 bp | 5102 | 38.94% | 40.23% | 45.56% | 35.12% |
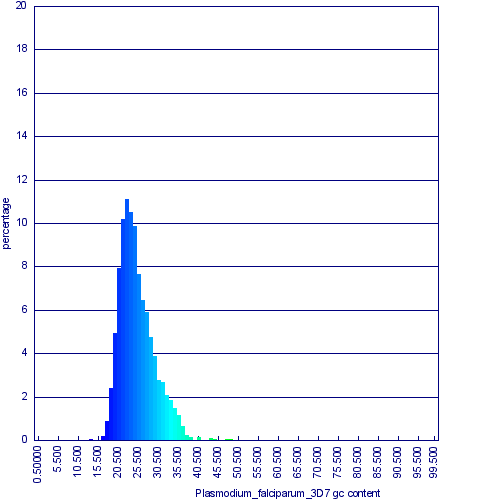
There physical structure is also very similar, as can be seen in a syntenic dotplot of their genomes. However, their GC content is very different. P. falicparum's overall GC content is 23% while P. knowlesi is 39%. Based on the similarities of their genomes' structures, this change in GC content is relatively recent, occurring after their lineages diverged between 2,000,000-10,000 years ago [1]. This change in their overall GC content is reflected in histograms of their respective CDS sequences, and their underlying codon and amino acid usages. Using syntenic gene pairs identified by their whole genome syntenic dotplot, protein alignments were generated and back translated to codon sequence alignments, and their entire data-set was used to calculate the log-odds score frequency of codon substitutions [2]. This substitution matrix is not symmetric. Each codon in each species has a different likelihood of being substituted than it being substituted back. This is a reflection of the apparent directionality in the GC content change.