SynMap
Overview
Specifying genomes
DAGChainer options
SynMap options
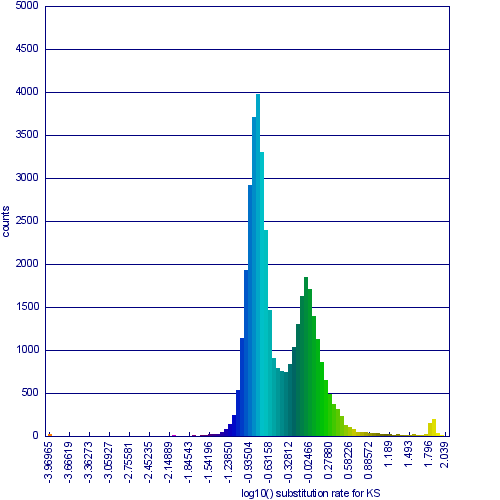
Calculating and displaying synonymous/non-synonymous (kS, kN) data
Interacting with results
Example Results


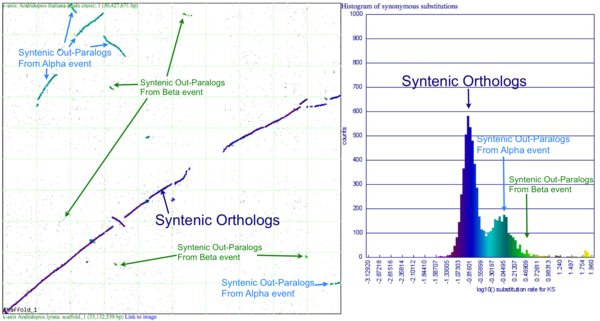
This example shows a whole genome syntenic dotplot comparison of Arabidopsis thaliana (At) and Arabidopsis lyrata (Al). These taxa diverged from one another ~5MYA
- Lysak MA, Berr A, Pecinka A, Schmidt R, McBreen K, Schubert I. Mechanisms of chromosome number reduction in Arabidopsis thaliana and related Brassicaceae species. Proceedings of the National Academy of Sciences of the United States of America. 2006 Mar 28;103(13):5224-5229.