Maize Sorghum Syntenic dotplot


Genome evolution of maize and sorghum
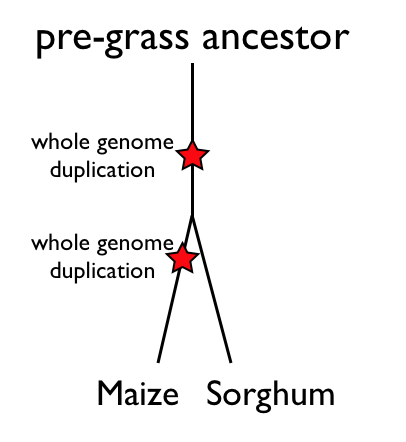
When comparing the genomes of maize and sorghum, there are three genomic evolutionary events that need to be considered. Figure 1 shows these events and listed in chronological order are:
- a whole genome duplication event that is shared among all the grasses
- the divergence of the maize and sorghum lineages
- the maize lineage-specific whole genome duplication event
Each one of these events creates a copy of the genome, and these events can be seen in a syntenic dotplot between these genomes.
Whole genome analysis using syntenic dotplots
A whole genome syntenic dotplot takes two genomes and lays them out end-to-end along each axis. In Figure 2, the sorghum genome is on the x-axis, and the maize genome is on the y-axis. Each black vertical and horizontal line delineates a chromosome. Each gene from those genomes are compared to one another and a dot is drawn at the appropriate x-y coordinate if two genes are similar in sequence. Genes with similar DNA sequence are putative homologs. These results are then fed into an algorithm to find collinear series of genes. If two genomic regions are related to one another through common descent from the same ancestral genomic region, then they will maintain a collinear arrangement of genes from that ancestor. While genomes can change, genes can move to new genomic positions, and duplicate genes lost, this pattern of collinear gene arrangement will be discernible for long evolutionary time periods and can be used to infer that two genomic regions are related through common ancestry (synteny). When such collinear arrangements are detected in this syntenic dotplot, those dots get colored. We call pairs of genes in a collinear arrangement syntenic gene pairs, or syntelogs.
Relative dating of genomic events and syntenic relationships
Since the whole genome duplication and lineage divergence events happened at different times in the history and evolution of maize and sorghum's lineages, the gene-pairs derived from those events are also of different ages. One way to measure the relative age of a pair of related genes is by estimating their rates of synonymous mutations. Genes that are more closely related usually have fewer synonymous changes than genes that are more distantly related. The rate of synonymous change has been measured for each pair of syntelogs identified in the maize-sorghum syntenic dotplot, and colored such that younger syntelogs (lower number of synonymous changes) are colored red, and older syntelogs (higher number of synonymous changes) are colored purple. Looking at the syntenic dotplot, it is now easy to identify red, younger sytnenic regions and purple, older syntenic regions.
Looking closely at the syntenic dotplot, there is an overlap of these colored lines when the lines are projected to one axis or the other. This is because a given region of one genome is syntenic to multiple regions in the other genome. Based on the series of events listed above, it is expected that for every region of the sorghum genome, there will be two red lines in maize because maize has had a whole genome duplication event after these lineages diverged. On the other hand, for each region of the maize genome, there will only be one red line in sorghum.
Understanding the purple lines is a bit more complicated. These syntenic regions are derived from the older shared whole genome duplication event. As seen with the red lines, for a given region of sorghum, there are two purple lines that come from maize's most recent whole genome duplication, and for a given region of maize, there will be a single purple line in sorghum.
All together, this means that there is a 2:4 syntenic relationship between sorghum and maize. There are two in sorghum form the pre-grass whole genome duplication event, and there are four in maize from the pre-grass whole genome duplication event combined with the subsequent maize-specific whole genome duplication event. This means that for any genomic region in maize or sorghum, there are a total of 5 other syntenic regions. This gives rise for the possibility of comparing 6 syntenic regions at once: 2 from sorghum and 4 from maize.
High-resolution analysis of syntenic regions using GEvo
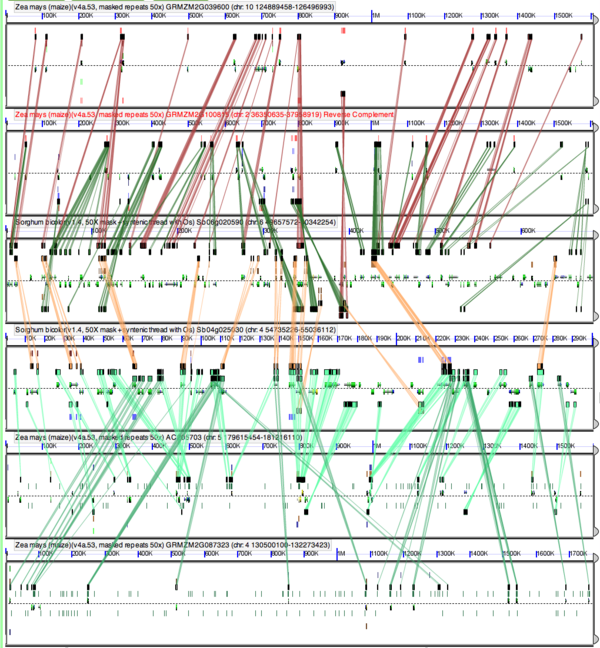
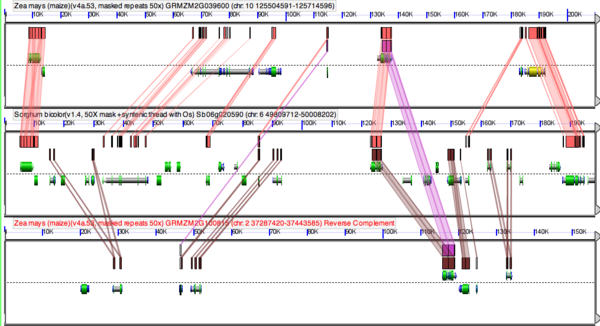
Another way to see these patterns is through high-resolution analysis of syntenic regions use GEvo. If SynMap is used to create and visualize syntenic dotplots, the results are interactive and provide links to GEvo. Figure 3 shows an example 6-way comparison of syntenic regions from maize sorghum dating back to the pre-grass whole genome duplication event. Each panel of the figure represents one genomic region. In this figure, the two sorghum regions derived from the pre-grass whole genome duplication event are the middle two panels, with two maize syntenic regions located above or below each sorghum region. These pairs of maize regions are derived from the maize-specific whole genome duplication event, the pairs of maize regions are orthologous to the closest sorghum region (derived from the divergence of their lineages), and the two sorghum regions are paralogous (or homeologous) to each other (derived from the pre-grass whole genome duplication event).
- Note: One additional feature of SynMap is that it will generate a summary table of all syntenic regions and the genes that are contained within each region. Each pair of genes will contain a link to GEvo. The file used in this example can be downloaded here: http://synteny.cnr.berkeley.edu/CoGe//diags/Sorghum_bicolor/Zea_mays_maize/6807_8082.CDS-CDS.blastn.dag_geneorder_D40_g20_A10.all.aligncoords.ks .
Fractionation of gene content following whole genome duplication events
In figure 3, pairwise comparisons of these regions have been performed in order to identify similar protein coding DNA sequences. For several comparisons, colored lines have been drawn connecting regions of sequence similarity. It is apparent that these lines have a collinear arrangement, and is evidence that the regions are syntenic. However, notice how there are different densities of lines for different comparisons. Each sorghum region has lines drawn connecting it to its two orthologous maize regions, and to the other sorghum region. When comparing the pair of sorghum regions, not all of the genes are shared. This is due to a process known as fractionation. Following a whole genome duplication event, many duplicated genes are lost from one homeologous region or its partner region over evolutionary time.
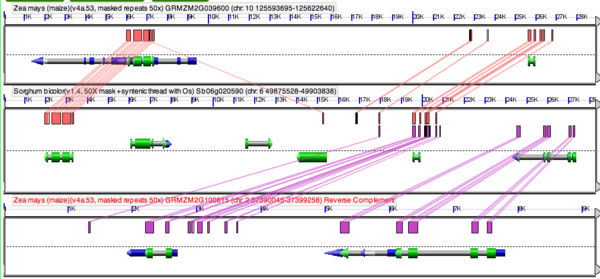
Fractionation is also seen between pairs of maize regions derived from the maize-specific whole genome duplication event. Figure 4 shows a high-resolution analysis using GEvo of a sorghum region to its two syntenic orthologous regions from maize. While a given sorghum region has nearly its entire gene content represented in its two orthologous maize regions, some genes are represented only in one of the two regions.