Plasmodia comparative genomics

From CoGepedia
Revision as of 12:42, 29 March 2010 by Elyons (Talk | contribs)

Jump to: navigation, search
Syntenic dotplot of Plasmodium falciparum (x-axis) and Plasmodium knowlesi (y-axis). Results can be regenerated at: http://synteny.cnr.berkeley.edu/CoGe/SynMap.pl?dsgid1=7949;dsgid2=2465;c=4;D=20;g=10;A=5;Dm=0;gm=0;w=0;b=1;ft1=1;ft2=1;do1=1;do2=1;do=40;dt=geneorder
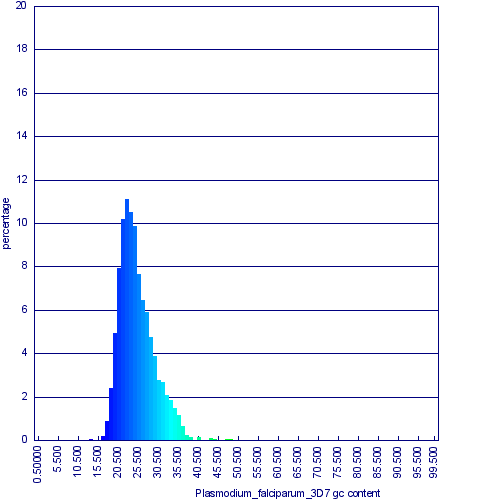
Histogram of CDS GC content for Plasmodium falciparum. Generated by OrganismView
Histogram of CDS GC content for Plasmodium knowlesi. Generated by OrganismView
Log-odds score substitution matrix of codons between Plasmodium falciparum (x-axis) and Plasmodium knowlesi (y-axis). P. falciparum is a low-GC genome and P. kowlesi is a mid-GC genome.

The genomes of two Plasmodium species, falciparum and knowlesi are structurally very similar to one another:

Organism Chromosome count Genome Length CDS count Genome GC content CDS GC content CDS Wobble position content non-coding GC content Plasmodium falicparum 14 22,860,235 bp 5267 19.88% 23.72% 17.30% 14.58% Plasmodium knowlesi 14 23,462,187 bp 5102 38.94% 40.23% 45.56% 35.12%

}