SynMap2
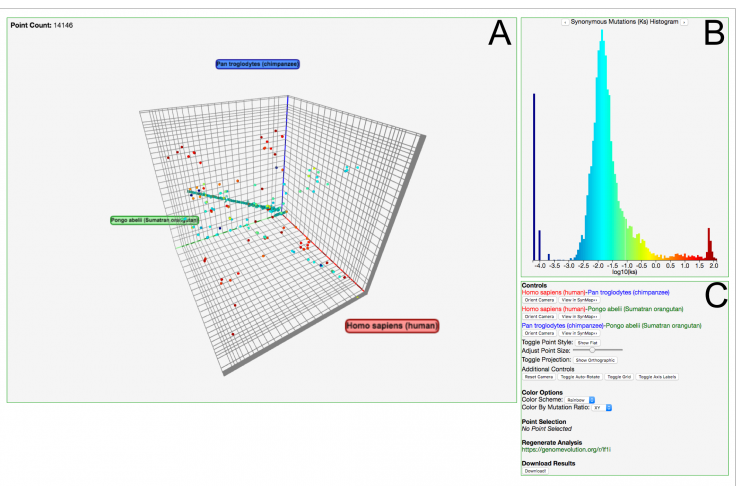
Note: This is the documentation for SynMap3D, if you are looking for SynMap2 look here.
Background
SynMap2 is a major reworking of the original SynMap pairwise whole-genome synteny viewer. While the underlying computational framework remains the same, SynMap2 rethinks the visualizations by replacing static images with a high performance and interactive web-based dot-plot viewer. SynMap2’s interactive features allow researchers to explore the dataset from multiple angles in a significantly more intuitive way such as would be expected from the modern web. For example, subsets of syntenic matches can be selected by chromosomal regions or by subset ranges of mutation values (Kn, Ks, or Kn/Ks), and as subsets are selected, the visualization is automatically updated. The subset selection algorithms are designed to work efficiently even when faced with comparisons with many points (such as found in many polyploid species. Another improved feature is auto-persistance based coloring, where an algorithm can determine the most significant peaks at different sensitivity levels and apply unique colors to each, thus allowing researchers to visually distinguish between major duplication events.

Other Options
Example Analyses
| Species 1 | Species 2 | Link |
|---|---|---|
| H. sapiens (human) | P. troglodytes (chimpanzee) | https://genomevolution.org/r/lg3o |
| H. sapiens (human) | C. familiaris (dog) | https://genomevolution.org/r/lknl |
| H. sapiens (human) | M. musculus (mouse) | https://genomevolution.org/r/lknm |
| A. thaliana | B. rapa | https://genomevolution.org/r/lknt |
| Z. mays (maize;corn) | S. bicolor (sorghum) | https://genomevolution.org/r/lknv |
| O. niloticus (Nile tilapia) | S. salar (Atlantic salmon) | https://genomevolution.org/r/lkoj |
| E. coli (MG1655) | E. coli (DH10B) | https://genomevolution.org/r/lkng |