MotifView
 MotifView at work | |
| Software company | CoGe Team |
|---|---|
| Analysis Type | Compare multiple genomic regions for motifs |
| Working state | Testing |
| Tools Utilized | blastn, LAGAN |
MotifView is a tool that visualizes motifs in compared genomic regions.
Introduction
MotifView uses visual and algorithmic tools to visualize motifs within multiple genomic regions. Sharing many functional similarities to GEvo, it's possible to compare sequences from any number of organisms using a variety of different sequence comparison algorithms.
On this page we provide only a brief description of options that are shared with GEvo. If descriptions and directions are ambiguous, please follow the links to specific sections to the GEvo instructions on that section.
MotifView basics
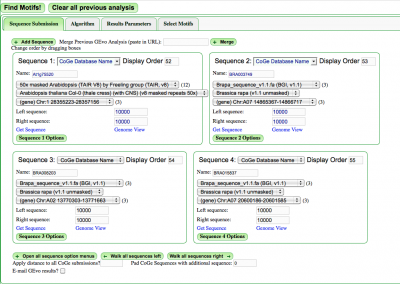
- Select genomic regions to analyze
- Select a sequence alignment algorithm appropriate for the sequences and area of interest
- Select motifs to visualize
- Press "Find Motifs!" button
To alternate between these options to configure an analysis, select the appropriate tab.
Sequence Submission
Select the "Sequence Submission" tab to open these options. Here, you can specify sequence submission boxes for each sequence that will be submitted for a MotifView anlaysis. This is also were you can adjust the amount of sequence analyzed, select which sequences are analyzed, reverse complement a sequence, mask a sequence according the the genomic features it contains, and change the display order of sequences.
The different options for submitting and modifying sequences to be visualized can be found here.
Merging Analyses
Often, there are times when you will want to merge together two or more separate GEvo anlayses. To do this, copy a GEvo link into the text-box next the text: "Merge Previous GEvo Analysis (paste in URL)" located at the top of the sequence submission tab. Then press the "Merge" button". The sequences as specified in the pasted URL will appear as new sequence submission boxes configured as specified in the link (extra up/downstream sequence, reverse complement, masked, etc.)
Alignment Algorithms
While many major algorithms exist for alignment, not all are suitable for the analysis available in MotifView. As such, MotifView compares genes at a scale that makes BlastN and LAGAN the most ideal algorithm choices. The options and suitability of available algorithms is discussed here.
Select Motifs
This tab allows the user to define how and which motifs will be found and analyzed.
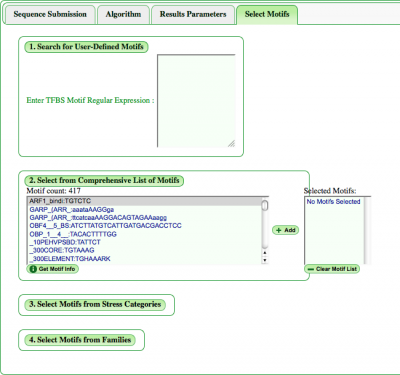
Choose TFBS Motif
You can manually enter a motif in the window next to "Enter TFBS Motif Regular Expression :".
Select from Comprehensive List of Motifs
Select Motifs from Categories
Additionally, there is a choice of provided motif categories. On toggling any category a pull down list of motifs linked to that stress, transcription factor family, etc, will appear for selection. If desired, a range of motifs not confined to categories is available below the categories. In addition, users can select or deselect all options in a category if needed.
Once motifs are chosen, press the "Find Motifs!" button above the tabs to begin analysis.
Regenerating/Saving a MotifView Analysis
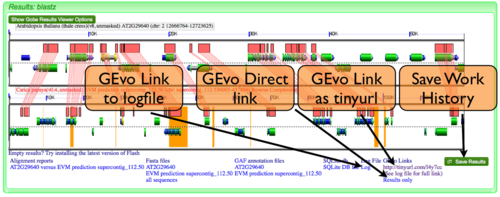
MotifView has the ability to regenerate past comparisons or save current comparisons. The ability to create links to, view, or save MotifView analyses is described in detail here.
Modifying result graphics
Showing Contigs

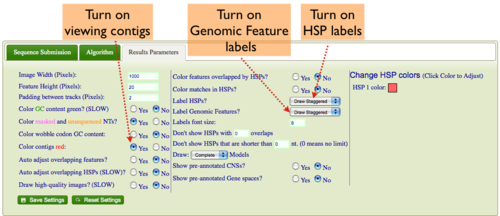
Some genomes have contig assembly information. To view this in MotifView's results:
- Select the "Results Parameters" tab from MotifView's configuration box
- Select "yes" for the option "Color contigs red".
Turning on labels for HSPs (blast hits) in MotifView's results
If you want to have the HSP number drawn on the HSP:
- Select the "Results Parameters" tab from MotifView's configuration box
- Select "yes" for the option "Label HSPs".
- You can have the labels drawn linearly, so each label is at the same vertical position for a track, or staggered, where they are drawn top, middle, bottom alternating.
Turning on labels for Genomic Features (e.g. genes) in MotifView's results
If you want to have the feature names drawn on the feature:
- Select the "Results Parameters" tab from MotifView's configuration box
- Select "yes" for the option "Label Genomic Features".
- You can have the labels drawn linearly, so each label is at the same vertical position for a track, or staggered, where they are drawn top, middle, bottom alternating.
Show Motifs overlapping with CNSs or any position in the Window
Motifs are often found within CNSs as protein binding sites or other functional DNA. However, motifs appear in many places and can be viewed anywhere in the window.
Expanding Overlapping Features and Regions of Sequence Similarity
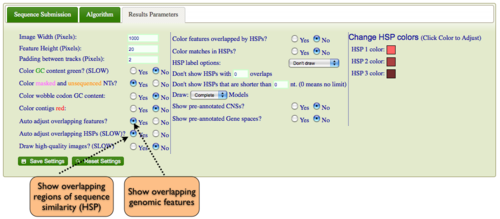
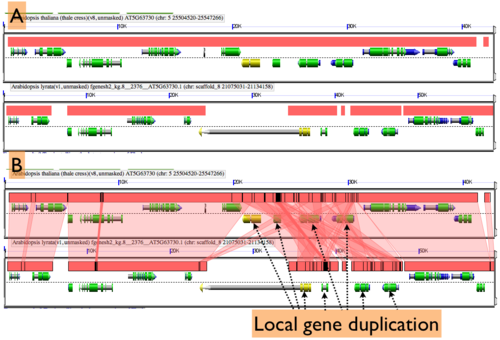
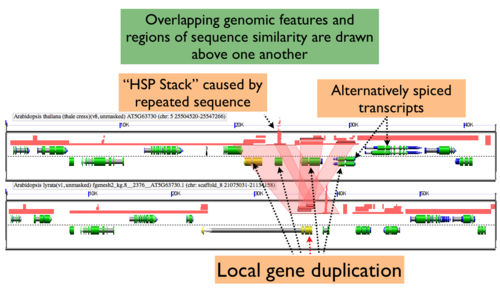
By default MotifView will drawn overlapping genomic features and regions of sequence similarity on top of one another. However, this sometimes hides some of the interesting complexities in a genomic region such as local duplications or regions containing repeated sequences. To view these, select the "Results Parameters" tab and select "Yes" for "Auto adjust overlapping features" and/or "Auto adjust overlapping HSPs". These options are set to "No" by default because finding and drawing overlapping features can take a long time to process, and are not always useful.
Refining an analysis
Once a GEvo analysis has run, you can change any of the analysis parameters and re-run the analysis by pressing the "Run GEvo analysis" button again. The common parameters changed are:
- The extent of the genomic region analyzed. The interactive results make this easy with slider bars.
- The algorithm used in the analysis
- Masking sequences
- Skipping sequences
- Reverse complementing sequences
- The coloration and information displayed in the result's graphics
Hints and Tricks
Sequences with many common sub-sequences
Comparing sequences with lots of common sub-sequences usually causes GEvo to take a very long time processing the analysis (both in terms of identifying the common sequences and generating the final results). Also, if many regions are identified, it is often difficult to make sense of the results. This kind of problem will surface in many large genomes, such as mammal and plant genomes. For example human and maize are both riddled with large amounts of repetitive sequences derived from retroviruses and transposons. This makes the comparison of large genome regions in these genomes difficult, if not impossible. To circumvent this problem, mask all sequence that does not code for protein. You can select this option under the "Sequence options" menu and selecting "non-CDS" for the row "Mask Sequence".
Example Analyses
Analysis of syntenic regions from Arabidopsis thaliana, Carica papaya, and Vitis vinifera
Linking to GEvo
Linking to GEvo is easy! Please see this page on how.
Tutorials
References
Frequently Asked Questions
Bug Report
Progress on bugs can be found here.