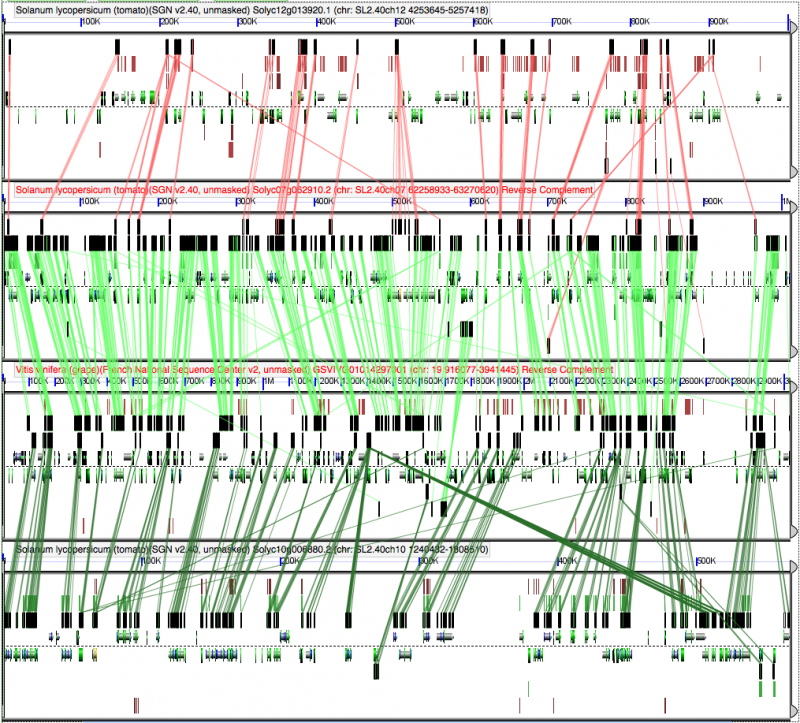
High-resolution syntenic analysis of tomato v. grapevine

Regions are ordered:
- Tomato 1
- Tomato 2
- Grapevine (outgroup)
- Tomato 3
Note the classic pattern of fractionation among the tomato regions in comparison to grape. Each tomato region's entire gene content is represented in grape, and the grape region's gene content is distributed among all three tomato regions.