SynMap
Overview
Specifying genomes
DAGChainer options
SynMap options
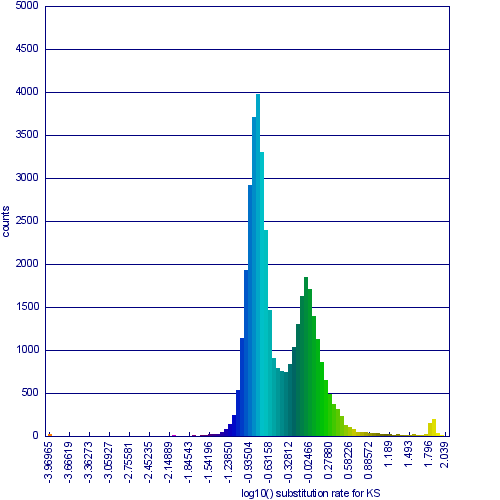
Calculating and displaying synonymous/non-synonymous (kS, kN) data
Interacting with results
Example Results


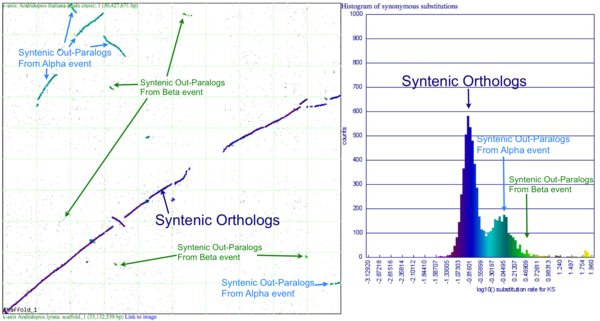
This example shows a whole genome syntenic dotplot comparison of Arabidopsis thaliana (At) and Arabidopsis lyrata (Al). These taxa diverged from one another ~5MYA