File:Master 3068 8.CDS-CDS.blastn geneorder D20 g10 A5.w2000.ks.png
Jump to navigation
Jump to search

Size of this preview: 800 × 463 pixels. Other resolution: 2,000 × 1,158 pixels.
Original file (2,000 × 1,158 pixels, file size: 115 KB, MIME type: image/png)
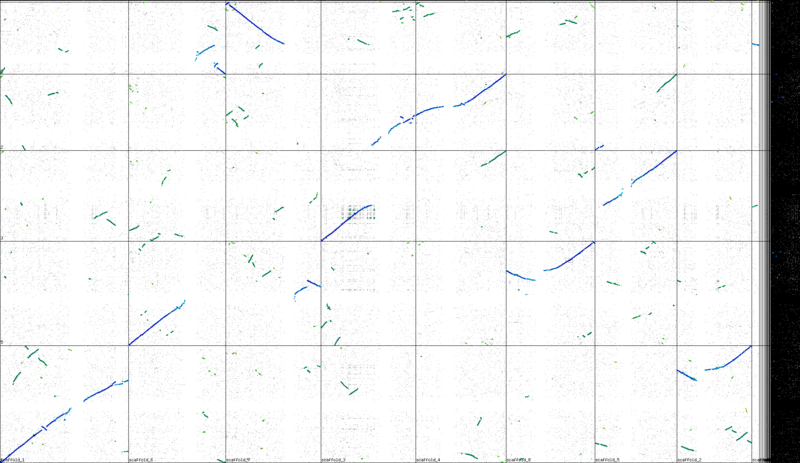
Syntenic dotplot between Arabidopsis thaliana and Arabidopsis lyrata. Regions of synteny were identified by DAGchainer. Syntelogs are colored based on their relative synonymous mutation rate as determined by CODEML.
File history
Click on a date/time to view the file as it appeared at that time.
| Date/Time | Thumbnail | Dimensions | User | Comment | |
|---|---|---|---|---|---|
| current | 16:59, 30 August 2009 | | 2,000 × 1,158 (115 KB) | Elyons (talk | contribs) | (Syntenic dotplot of Arabidopsis thaliana versus Arabidopsis lyrata. Syntenic gene pairs identified by DagChainer have been colored based on there synonymous rate (kS) data as calculated by CODEML. Results can be regenerated at http://synteny.cnr.berkeley |
| 18:29, 27 August 2009 |  | 2,000 × 1,153 (155 KB) | Elyons (talk | contribs) | Syntenic dotplot of Arabidopsis thaliana versus Arabidopsis lyrata. Syntenic gene pairs identified by DagChainer have been colored based on there synonymous rate (kS) data as calculated by CODEML. Results can be regenerated at http://synteny.cnr.berkeley | |
| 05:06, 13 May 2009 |  | 2,000 × 1,153 (154 KB) | Elyons (talk | contribs) | Syntenic dotplot between Arabidopsis thaliana and Arabidopsis lyrata. Regions of synteny were identified by DAGchainer. Syntelogs are colored based on their relative synonymous mutation rate as determined by CODEML. |
You cannot overwrite this file.
File usage
The following 4 pages use this file: