File:Master 7146 9105.CDS-CDS.blastn.dag.go c4 D20 g10 A5.aligncoords.gcoords ct0.w2000.gene.png
Jump to navigation
Jump to search
Size of this preview: 600 × 600 pixels. Other resolution: 2,000 × 2,000 pixels.
Original file (2,000 × 2,000 pixels, file size: 27 KB, MIME type: image/png)
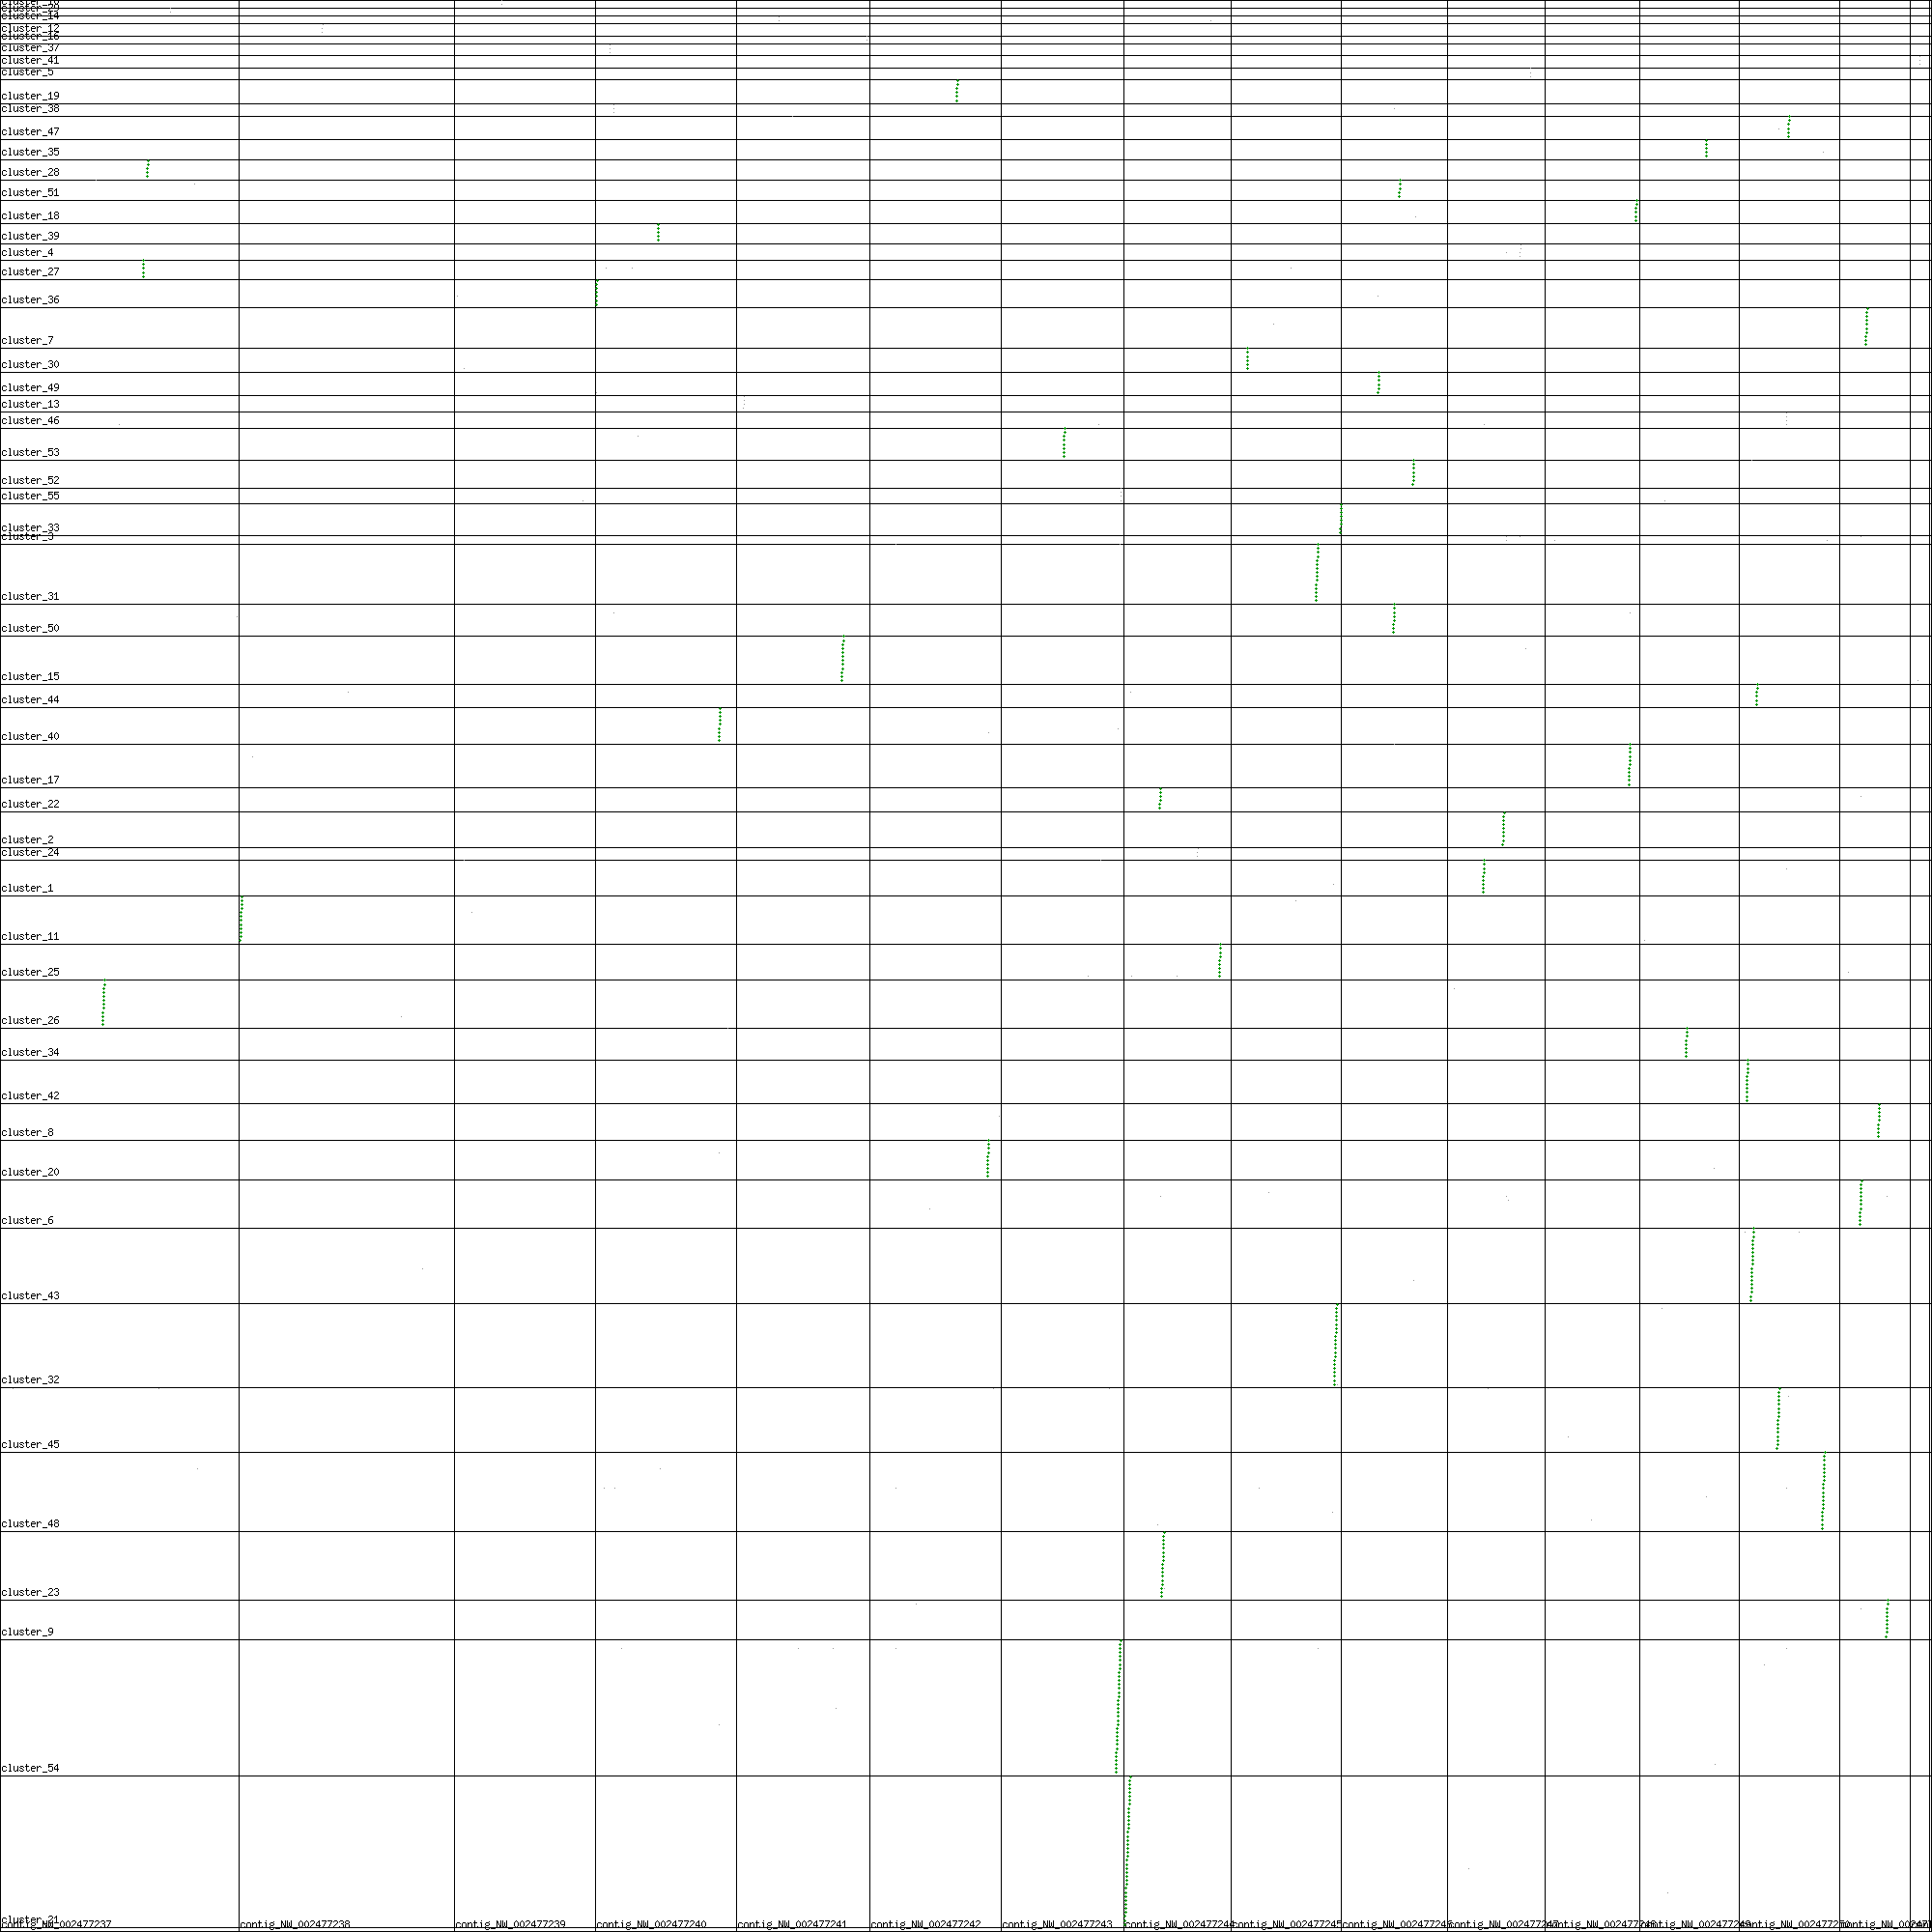
Syntenic dotplot of Aspergillus flavus versus a minimized genome consisting of only genomic regions containing metabolic gene clusters. Axis metrics in gene units (not nucleotides). http://genomevolution.org/CoGe/SynMap.pl?dsgid1=7146;dsgid2=9105;c=4;D=20;g=10;A=5;Dm=0;gm=0;w=0;b=1;ft1=1;ft2=1;do1=1;do2=1;do=40;dt=geneorder;am=g
File history
Click on a date/time to view the file as it appeared at that time.
| Date/Time | Thumbnail | Dimensions | User | Comment | |
|---|---|---|---|---|---|
| current | 20:16, 27 April 2010 | | 2,000 × 2,000 (27 KB) | Elyons (talk | contribs) | Syntenic dotplot of Aspergillus flavus versus a minimized genome consisting of only genomic regions containing metabolic gene clusters. Axis metrics in gene units (not nucleotides). http://genomevolution.org/CoGe/SynMap.pl?dsgid1=7146;dsgid2=9105;c=4;D=2 |
You cannot overwrite this file.
File usage
The following page uses this file: