Non-X-alignments: Difference between revisions
Jump to navigation
Jump to search
| Line 12: | Line 12: | ||
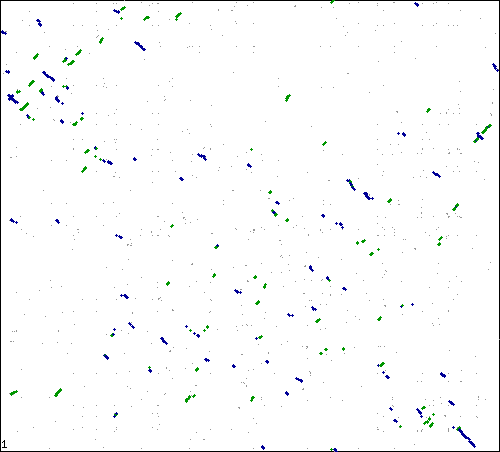
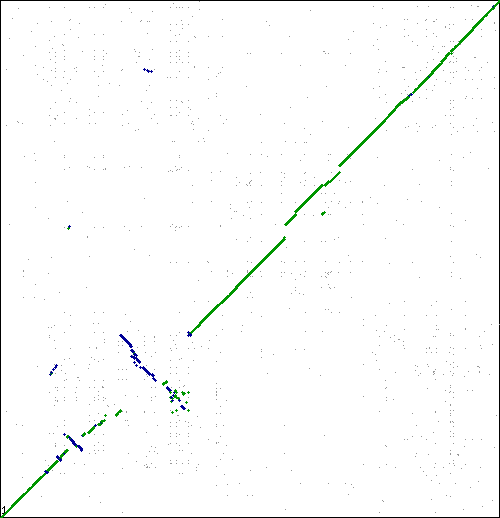
[[Image:Master 8988 6963.CDS-CDS.lastz.dag.go c4 D20 g10 A5.aligncoords.gcoords ctinv.w500.png|thumb|center|500px|Syntenic dotplot generated by SynMap between two strains of Sulfolobus islandicus: L.D.8.5 (x-axis); Y.G.57.14 (y-axis). Results can be regenerated at: http://genomevolution.org/r/oso]] | [[Image:Master 8988 6963.CDS-CDS.lastz.dag.go c4 D20 g10 A5.aligncoords.gcoords ctinv.w500.png|thumb|center|500px|Syntenic dotplot generated by SynMap between two strains of Sulfolobus islandicus: L.D.8.5 (x-axis); Y.G.57.14 (y-axis). Results can be regenerated at: http://genomevolution.org/r/oso]] | ||
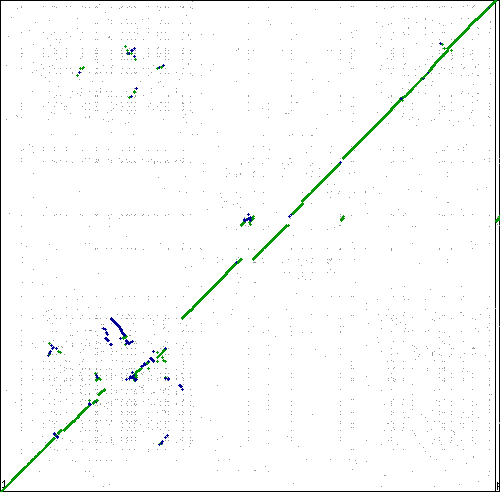
[[Image:Master 6946 6963.CDS-CDS.lastz.dag.go c4 D20 g10 A5.aligncoords.gcoords ctinv.w500.png|thumb|center|500px|Syntenic dotplot generated by SynMap between two strains of Sulfolobus islandicus: strain L.S.2.15 (x-axis); strain Y.G.57.14 (y-axis). Results can be regenerated at: http://genomevolution.org/r/osp]] | |||
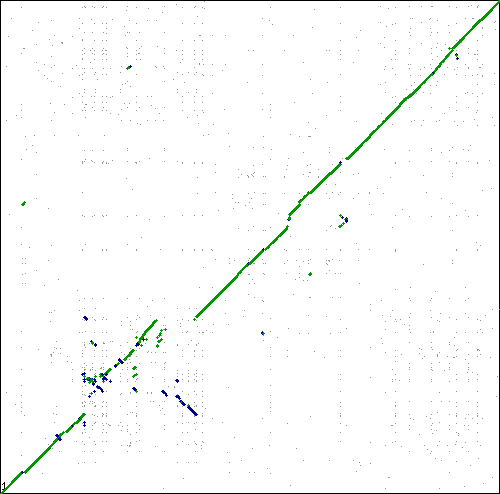
[[Image:6963 3408.CDS-CDS.lastz.dag.go c4 D20 g10 A5.aligncoords.gcoords.1-1.w800.flip.ct inv.png|thumb|center|500px|Syntenic dotplot generated by SynMap between two species of Sulfolobus: solfataricus strain P2 (x-axis); islandicus strain Y.G.57.14 (y-axis). Results can be regenerated at: http://genomevolution.org/r/osg]] | [[Image:6963 3408.CDS-CDS.lastz.dag.go c4 D20 g10 A5.aligncoords.gcoords.1-1.w800.flip.ct inv.png|thumb|center|500px|Syntenic dotplot generated by SynMap between two species of Sulfolobus: solfataricus strain P2 (x-axis); islandicus strain Y.G.57.14 (y-axis). Results can be regenerated at: http://genomevolution.org/r/osg]] | ||
Latest revision as of 20:42, 21 August 2010
This tracks examples of bacteria and archaea syntenic dotplots which do not show the classical x-alignment pattern of inversions. One possible methodological reason for these non-x-alignments is mis-assembly.
Genome-wide random orientation


Local region of syntenic instability
These are interesting. Lots of inversions at the same local sub-regions, but not around a single point in the genome. Multiple events appear to be independent by comparison to different genomes. Perhaps there is some factor contributing to a local region of syntenic instability?


