Alligator v. Chicken: Difference between revisions
No edit summary |
No edit summary |
||
| Line 1: | Line 1: | ||
[[File:Alligator.png]] vs. [[File:Chicken.png]] | [[File:Alligator.png]] vs. [[File:Chicken.png]] | ||
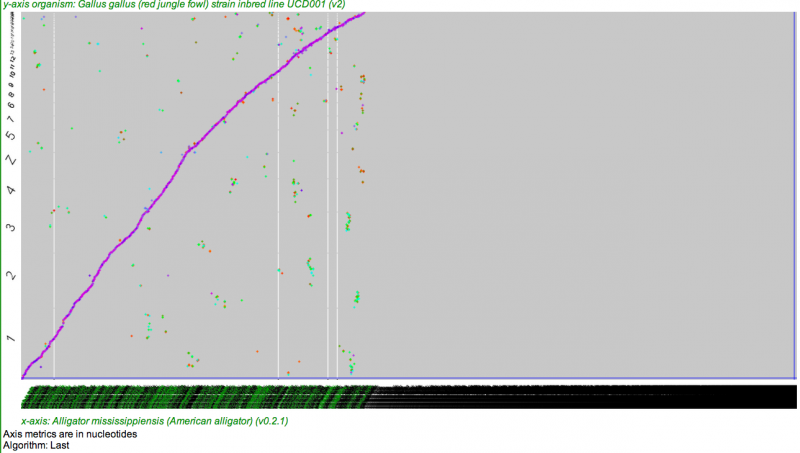
[[File:Screen shot 2012-10-03 at 8.38.05 AM.png|thumb|none|800px|[[SynMap]] analysis of Alligator (x-axis) to Chicken (y-axis). Alligator contigs ordered and oriented according to their [[Syntenic Path]] to chicken chromosomes, and syntenic gene pairs are colored by their synonymous mutation rates. Note that nearly the entire chicken genome is covered by alligator contigs, but there are many alligator contigs that are not syntenically mapped to chicken. These probably contain few genes to extract a syntenic signal (minimum of three genes required by this analyis) or are made up of only non-genic (repetitive) sequences.]] | [[File:Screen shot 2012-10-03 at 8.38.05 AM.png|thumb|none|800px|[[SynMap]] analysis of Alligator (x-axis) to Chicken (y-axis). Alligator contigs ordered and oriented according to their [[Syntenic Path]] to chicken chromosomes, and syntenic gene pairs are colored by their synonymous mutation rates. Note that nearly the entire chicken genome is covered by alligator contigs, but there are many alligator contigs that are not syntenically mapped to chicken. These probably contain few genes to extract a syntenic signal (minimum of three genes required by this analyis) or are made up of only non-genic (repetitive) sequences. Also, the regions of secondary synteny (not on the 45-degree line) are probably due to most recent paleo-tetraploidy event in the vertebrate lineage (1R or 2R). Results may be regenerated at: http://genomevolution.org/r/5ec3]] | ||
[[File:Master 19558 2731.CDS-CDS.last.dag.all.go D20 g10 A3.aligncoords.gcoords ct0.w1000.spa1.ks.sr.cs1.csoS.log.nsd.hist.png|thumb|400px|none|Ks value histogram. Ks values have been log transformed and colors in histogram correspond to colored dots in dotplot. Note that the red-orange peak on the right represets noise in the analysis for incorrectly called syntenic gene pairs, pseudogenes, bad gene models, etc.]] | [[File:Master 19558 2731.CDS-CDS.last.dag.all.go D20 g10 A3.aligncoords.gcoords ct0.w1000.spa1.ks.sr.cs1.csoS.log.nsd.hist.png|thumb|400px|none|Ks value histogram. Ks values have been log transformed and colors in histogram correspond to colored dots in dotplot. Note that the red-orange peak on the right represets noise in the analysis for incorrectly called syntenic gene pairs, pseudogenes, bad gene models, etc.]] | ||
| Line 10: | Line 10: | ||
## Information on parsing the file: [http://genomevolution.org/wiki/index.php?title=SynMap#Results] | ## Information on parsing the file: [http://genomevolution.org/wiki/index.php?title=SynMap#Results] | ||
# Mapping of alligator contigs to chicken: "Syntenic Path Assembly mapping" | # Mapping of alligator contigs to chicken: "Syntenic Path Assembly mapping" | ||
Note: There is the option to screen syntenic regions using [[syntenic depth]], but this option is not compatible with the [[syntenic path assembly]]. Screening with a 1:1 syntenic depth will remove most of the older syntenic regions derived from the most recent shared tetraploidy event in these lineages (useful for identifying syntenic orthologous genes. However, you won't produce as pretty of a graphic as when you use the syntenic path assembly. | |||
#Syntenic depth 1:1 : http://genomevolution.org/r/5ed6 | |||
[[SynFind]] is another program that identifies syntenic genes using a different algorithm and procedure than SynMap. One difference is the ability to identify syntenic regions where a given gene is missing. Using this on a genome like alligator, with many small contigs, produces some interesting results. Namely, SynFind will identify many alligator contigs that are syntenic to a given chicken genomic region. | |||
# Master syntenic table between chicken and alligator: http://genomevolution.org/CoGe/SynFind.pl?fid=21867937;qdsgid=2731;dsgid=19527;ws=20;co=3;sf=1;algo=last;get_master=1 | |||
## Information on parsing this table: http://genomevolution.org/wiki/index.php/SynFind#Master_syntenic_pairs_table | |||
# SynFind analysis: http://genomevolution.org/r/5eea | |||
Revision as of 17:09, 3 October 2012


Links to data are in the "Links and Downloads" section of the results. Links of interest:
- SynMap syntenic gene pairs: "Final syntenic gene-set output with GEvo links"
- Information on parsing the file: [1]
- Mapping of alligator contigs to chicken: "Syntenic Path Assembly mapping"
Note: There is the option to screen syntenic regions using syntenic depth, but this option is not compatible with the syntenic path assembly. Screening with a 1:1 syntenic depth will remove most of the older syntenic regions derived from the most recent shared tetraploidy event in these lineages (useful for identifying syntenic orthologous genes. However, you won't produce as pretty of a graphic as when you use the syntenic path assembly.
- Syntenic depth 1:1 : http://genomevolution.org/r/5ed6
SynFind is another program that identifies syntenic genes using a different algorithm and procedure than SynMap. One difference is the ability to identify syntenic regions where a given gene is missing. Using this on a genome like alligator, with many small contigs, produces some interesting results. Namely, SynFind will identify many alligator contigs that are syntenic to a given chicken genomic region.
- Master syntenic table between chicken and alligator: http://genomevolution.org/CoGe/SynFind.pl?fid=21867937;qdsgid=2731;dsgid=19527;ws=20;co=3;sf=1;algo=last;get_master=1
- Information on parsing this table: http://genomevolution.org/wiki/index.php/SynFind#Master_syntenic_pairs_table
- SynFind analysis: http://genomevolution.org/r/5eea

