Tomato v. tomato
Jump to navigation
Jump to search


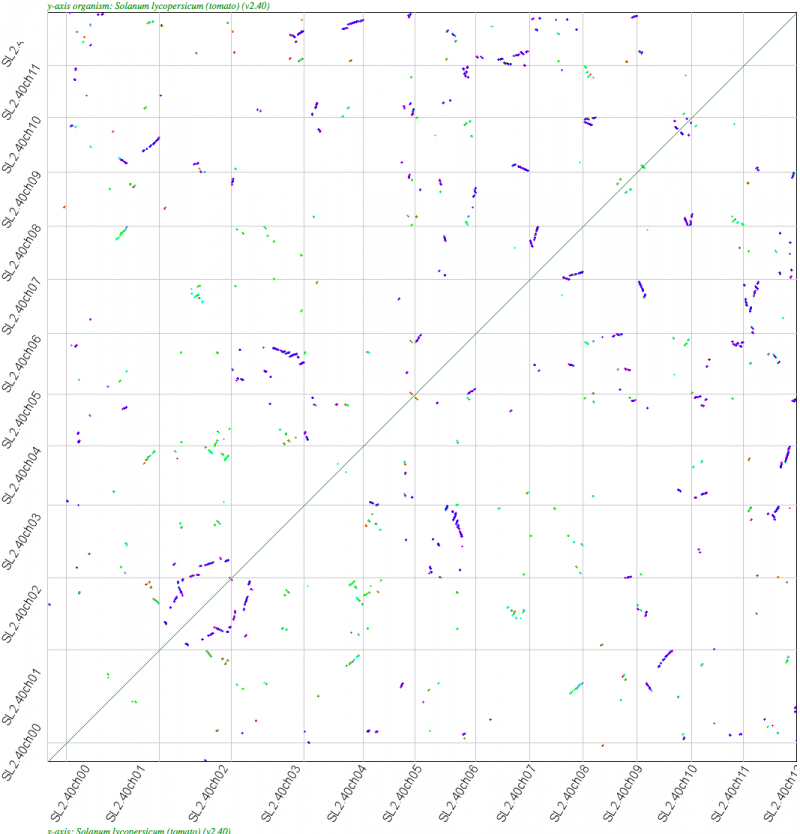
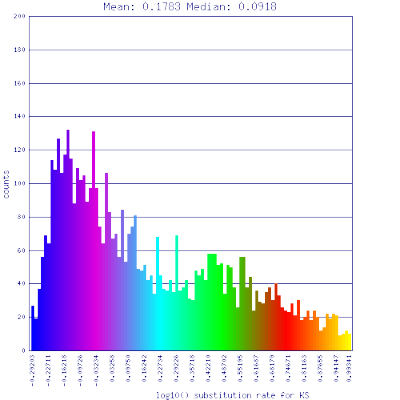
Blue dots in the syntenic dotplot and blue regions in the Ks histogram are from tomatos most recent polyploidy event. Green are from a more ancient polyploidy event, most likely the eudicot paleohexaploidy. The majority of the regions are synteny to one other region in the genome (evidence for tetraploidy), with a few regions being syntenic to two other regions (evidence for hexaploidy).