Variant data
Jump to navigation
Jump to search
EPIC-CoGe's genome browser supports the visualization of variant data on any genome in CoGe.
You can load and visualize variant data by:
- Loading a VCF file for a genome using LoadExperiment
- Note: One loaded file in coge is called an experiment
- Using GenomeView to browse the genome
- Select the appropriate experiment for visualization
Visualizing Variant Data
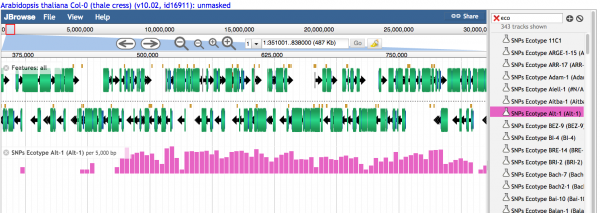
Histograms showing the relative number of variants are visualized when the density is high

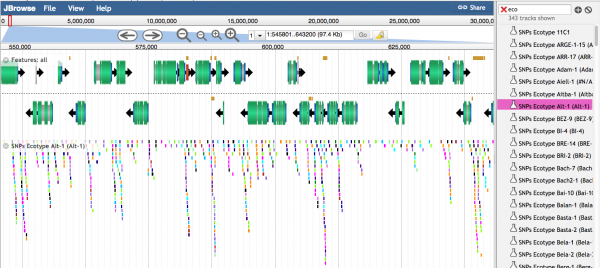
Individual variants are seen when the density of variants is lower. Different colors represent different types of SNPs

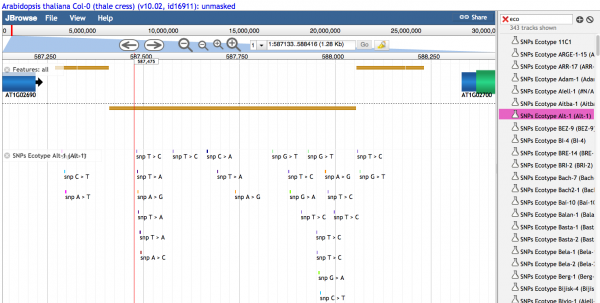
Text describing the variant is seen when density of variants is sufficiently low.
