Difference between revisions of "GC content shift"
From CoGepedia
(→Comparison of Schizosaccharomyces fungi japonicus strain yFS275 and pombe 972h-) |
(→Comparison of Schizosaccharomyces fungi japonicus strain yFS275 and pombe 972h-) |
||
| Line 14: | Line 14: | ||
|- | |- | ||
! scope="row" | Length | ! scope="row" | Length | ||
| − | | | + | | 11,300,431 || 10,082,004 |
|- | |- | ||
! scope="row" | GC% | ! scope="row" | GC% | ||
| − | | | + | | 42.6 || 36 |
|- | |- | ||
! scope="row" | AT% | ! scope="row" | AT% | ||
| − | | | + | | 54.9 || 64 |
|- | |- | ||
! scope="row" | CDS GC% | ! scope="row" | CDS GC% | ||
| − | | | + | | 45.5 || 39.5 |
|- | |- | ||
! scope="row" | CDS AT% | ! scope="row" | CDS AT% | ||
| − | | 5 || 60.5 | + | | 54.5 || 60.5 |
|- | |- | ||
! scope="row" | Wobble GC% | ! scope="row" | Wobble GC% | ||
| − | | | + | | 44.1 || 32.8 |
|- | |- | ||
! scope="row" | Wobble AT% | ! scope="row" | Wobble AT% | ||
| − | | | + | | 55.9 || 67.2 |
|} | |} | ||
Revision as of 17:00, 25 August 2010
GC content shift is an evolutionary genome-wide change in the GC content of an organism. The evolutionary consequences of such a change is unknown. They are detected by comparing the genomes of two related organisms that share a recent common ancestor, and determining if their have different:
- AT/GC genomic composition
- High rate of synonymous mutations for syntenic gene pairs
- Amino acid usage frequencies
- Codon usage frequencies
Comparison of Schizosaccharomyces fungi japonicus strain yFS275 and pombe 972h-
| japonicus | pombe | |
|---|---|---|
| Length | 11,300,431 | 10,082,004 |
| GC% | 42.6 | 36 |
| AT% | 54.9 | 64 |
| CDS GC% | 45.5 | 39.5 |
| CDS AT% | 54.5 | 60.5 |
| Wobble GC% | 44.1 | 32.8 |
| Wobble AT% | 55.9 | 67.2 |

SynMap syntenic dotplot of two Schizosaccharomyces fungi: japonicus strain yFS275 (x-axis) and pombe 972h (y-axis). Syntenic gene pairs are colored based on their synonymous mutation rates (see histogram below). While there have been many genomic rearrangements since these lineages diverged, nearly every genomic regions in both species have a syntenic partner region (albeit it small regions of contiguous synteny). Results may be regenerated at: http://genomevolution.org/r/pi4

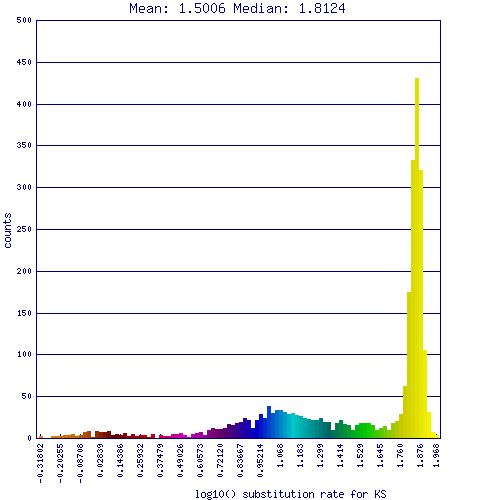
Histogram of synonymous mutation rates (Ks) for syntenic gene pairs identified between the Schizosaccharomyces fungi: japonicus strain yFS275 and pombe 972h. The Ks values have been log transformed. The yellow peak on the right (log(10) Ks ~ 1.8) is usually considered to be noise as they reflect an estimate of 60 changes per synonymous position. This many changes is beyond the saturation limits of the method used to estimate Ks (CodeML). This peak is the result of a GC content shift in one or both of these genomes since their divergence from a common ancestor. Results may be regenerated at http://genomevolution.org/r/pi4

GEvo analysis of syntenic regions from the Schizosaccharomyces fungi japonicus strain yFS275 (top) and pombe 972h- (bottom). Gene models are colored based on the percent GC content of GC3. Red is AT rich; green GC rich; yellow 50/50 AT/GC. Results may be regenerated at: http://genomevolution.org/r/pi7