Difference between revisions of "Tomato v. tomato"
From CoGepedia
(Created page with '[[SynMap syntenic dotplot of tomato v. itself with Ks colors for syntenic gene pairs. Results may be...') |
(No difference)
|
Latest revision as of 09:30, 1 June 2012

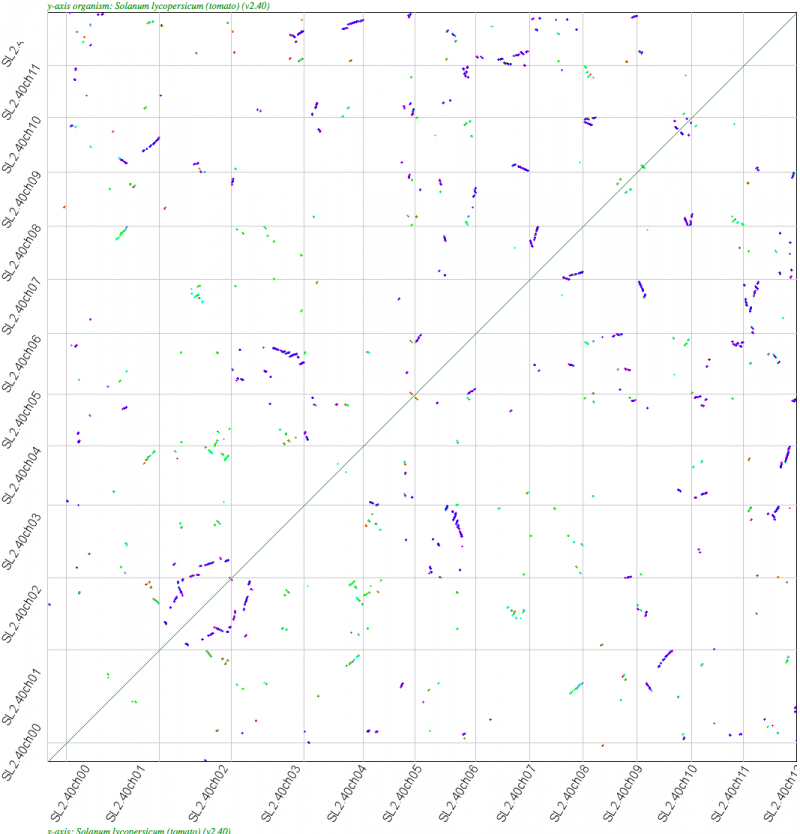
SynMap syntenic dotplot of tomato v. itself with Ks colors for syntenic gene pairs. Results may be regenerated: http://genomevolution.org/r/4tpr

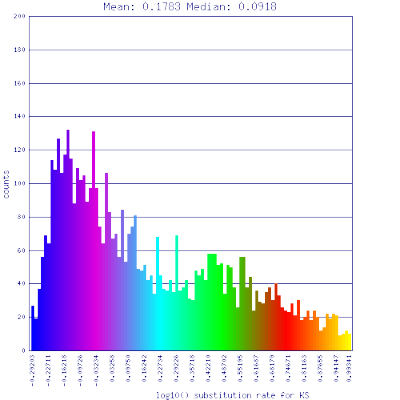
Ks histogram of syntenic gene pairs identified between a self-self comparison of tomato. Results may be regenerated: http://genomevolution.org/r/4tpr
Blue dots in the syntenic dotplot and blue regions in the Ks histogram are from tomatos most recent polyploidy event. Green are from a more ancient polyploidy event, most likely the eudicot paleohexaploidy. The majority of the regions are synteny to one other region in the genome (evidence for tetraploidy), with a few regions being syntenic to two other regions (evidence for hexaploidy).