Using CoGe for the analysis of Plasmodium spp
A brief introduction to Plasmodium genome evolution
As is the case for many Apicomplexa genomes, Plasmodium genomes are small (approx. 17-28Mb), share a reduced number of transposable elements, and have suffered numerous gene loss events. This type of genome reduction is a trait commonly associated with parasitism. Nonetheless, Apicomplexan genomes, and those of the genus Plasmodium in particular, tend to be quite dynamic. A previously discussed aspect of Apicomplexan evolution is the marked loss of synteny between genera [1]; however, while this trait is far less pronounced between species of a single genus, Plasmodium species have shown a largely complex and variable genome marked by numerous clade specific evolutionary rearrangements. This aspects, along to the high adaptability of the genome to specific stressors at a population level, point out to a largely changeable genome. The drivers of this recent level of rearrangement still remain to be fully explored, but are likely to be related to the host shift events thought to have occurred during the evolution of the genus, and the genus geographical expansion.
Nonetheless, despite these large shifts in synteny, all Plasmodium parasites are capable to complete infection of both an Anopheles vector and a corresponding vertebrates host, even if species-specific preferences are prevalent. This indicates a set of fundamental or core genes shared by all Plasmodium species, which functionality might not be affected by gene gain/loss events or even loss of synteny. Interestedly however, even ortholog genes shared across all sequenced Plasmodium species have shown to experience species-specific substitution rates. This types of changes are, in part, the result of selective pressures imposed on certain genome elements; nonetheless, they are also likely to reflect species-specific patterns of genome variability. Both this patterns are mayor drivers in the divergence genome evolution observed in the Plasmodium genus and can, with the aid of proper comparative genomic tools, help us track the evolutionary history of these changes.
One of the many challenging characteristics of Plasmodium genomes, is their rapid change in GC content during a reduced time period. Significant shifts in GC content have been reported in both in Bacteria and certain plant groups. However, the GC content variability observed within Plasmodium species seems to be a characteristic unique to this genus within Apicomplexa. This variability not only posses significant challenges in genome sequencing, but it also has a fundamental role on codon and amino acid usage within Plasmodium, the mutability of Plasmodium genomes (particularly those which are GC rich), and the nature and evolution of low complexity regions and other repetitive elements. By using the proper comparative genomic tools is possible to assess the evolutionary origins of the shift on GC content across the Plasmodium genus and perhaps determine their relation with changes in the type and the intensity of host infections.
The increase in funding devoted to malaria research during recent years has come hand in hand with the augmented understanding of Plasmodium genetics. At the moment, there is an unprecedented amount of Plasmodium genomes and gene sequences publicly available in diverse databases, ready to be used in furthering our understanding of Plasmodium genome evolution. As many other causal agents of tropical diseases Plasmodium genomes do not follow classical evolutionary patterns, making the implementation of novel and nontraditional tools necessary a necessity for Plasmodium research. With the increment of available Plasmodium sequences is possible to identify the likely origin of certain genomic landscapes within the genus, track conserved and unique genes across closely and less closely related species, and make inferences on the historical pressures leading to these changes as well as their putative consequences.
Finding and importing data into CoGe
Finding about the Plasmodium genomes already present in CoGe
The number of Plasmodium genomes available to the public increases yearly. Numerous research groups are working on completing the Plasmodium genome panorama, leading to reposition of diverse genome sequences under diverse levels of completion and originating from a variety of databases. A large number of Plasmodium genomes have been deposited on the National Center for Biotechnology Information (NCBI); however, additional databases such as PlasmoDB, GeneDB and MalAvi also carry additional Plasmodium genomes.
In order to attain a better picture of Plasmodium spp. genome evolution, the CoGe platform can be used to perform diverse comparative analyses. Currently, there is a large number of Plasmodium genomes available on the CoGe database. You can identify these Plasmodium genomes by:
A. Typing the word in "plasmod" into the Search bar at the top of most pages. This will retrieve all organisms and genomes with names matching the search term.
B. Follow these steps:
1. Go to: https://genomevolution.org/coge/
2. Create an account / login into CoGe: How to get a CoGe account
3. On the main CoGe page, find the Tools tile and click on to Organism View (https://genomevolution.org/coge/OrganismView.pl)
4. Organism View allows the researcher to find all publicly available genomes uploaded into CoGe and browse any corresponding information. You can find any published genome by typing a scientific name into the Search box. For each organism uploaded to CoGe you will find the following information:
- Organisms: In the case of Plasmodium spp., the different parasitic strains currently uploaded. Any organelle genomes independently uploaded (mitochondrial and apicoplast) can also be found here.
- Organism Information: provides an outline of organisms’ taxonomy (following that published on NCBI), quick links to some of the main CoGe analysis tools, and the search engines were information can be found.
- Genomes: All the genome versions for this species. Selecting different genome versions modifies al other output observed in this page; in addition, it allows the user to access to previous versions of a published genome (e.g. access scaffolds from a previous genome version currently under the chromosome assemble level).
- Genome information: Shows the genome IDs, type of sequences uploaded and length of the whole genome. In addition, this tab allows the user to directly perform analyses using the CoGe platform.
- Datasets: This section will show the number of datasets included for this genome. In the case of completely sequenced Plasmodium genomes, this will indicate the code numbers for the datasets of each individual chromosome.
- Dataset information: Provides specific information for each individually selected dataset including. Information includes the accession numbers (if available), source of the upload, chromosome length and GC%.
- Chromosomes: Shows the number of available chromosome for the selected genome. However, depending of the methodology used to upload the data into CoGe and the nature of the dataset itself, the count and length of chromosomes shown will be larger than expected (e.g. will show the number of contigs in lieu of the number of chromosomes). For whole sequenced genomes, specific IDs under the Dataset section will showcase the chromosome number and length.
- Chromosome information: Shows the chromosome ID and the number of base pairs for that chromosome.
5. Under Genome Information, clicking on the Genome Info section permits the user to access to a more detailed genome description. It also allows access to other quick links to comparative analysis tools available on CoGe.
Keep in mind that only publicly available genomes imported to CoGe can have a Public or Restricted display. Genomes made public can be seen and analyzed by anyone using the CoGe platform. On the other hand, Restricted genomes can only be seen/analyzed by the user or those with whom the information has been shared with: Sharing_data
Importing Plasmodium genomes into CoGe
While data can be uploaded into CoGe using a variety of methods, we will focus on the two most relevant for the incorporation of Plasmodium genomes. We will follow each method with an example. For additional information, please check the following link: How_to_load_genomes_into_CoGe
Importing genomes from using the "Upload" method
- Depending on the researcher's interests, it might be desired to perform analyses using complete Plasmodium genomes or focus only in specific organelles and chromosomes. In order to upload a complete Plasmodium genome, make sure to follow these steps:

- 1. In the upper part of the screen, find the Representative Genome section. Below, the Download Sequences in FASTA format and Download Genome Annotation sections can be found.
- - To download the complete Plasmodium vivax genome, click on Genome under Download Sequences in FASTA
- - To download the complete annotation for the Plasmodium vivax genome, clich on GFF under Download Genome Annotation
- 2. Both files will be downloaded to your desired folder into your local computer.

- 3. Go to: https://genomevolution.org/coge/
- 4. Login into CoGe.
- 5. Click on the MyData section on the upper left part of the screen.
- 6. This will lead to the Data section of your personal CoGe page. This section will fill up as genomes of interest are uploaded into CoGe.
- 7. On the upper left section of the screen, click the NEW button and select New Genome from the dropdown menu.
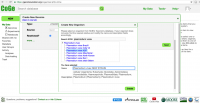
- 8. Once on the page to Create a New Genome into CoGe, information about the organisms taxonomy and the genome's origin must be inputed. Depending of the type of organism being uploaded, taxonomic information might have not been yet included into CoGe. If this is the case, a new organisms should be created. To do this the following steps should be followed:
- a. Click on NEW on the "Organism:" section
- b. On the Search NCBI box type the scientific name of the organism to be uploaded. If the organism of interest is not on NCBI, select the closet taxonomic relative. In the case of Plasmodium several strains might be available for a single species, make sure to select the correct strain or, if a new strain is being uploaded, to add the new strain name.
- c. Click Create
- 9. Once the new strain/genome has been added, additional information should be included as well. Depending on the number of genome versions for the selected genome available at CoGe, a different number will be typed on Version. Thus, it is important to check the number of genome version already available on CoGe before inputing a new version. Under the section named Type, select the adequate sequence type from the drop menu (most sequences can be identified as unmasked, Masked). Select the Source from the next dropdown menu (in this case NCBI, but there are many other sources available including Private sources). Check if you desire your genome to be Restricted or not.
- - Restricted genomes can only be seen and analyzed by the user and those to whom it has been shared.
- - Unrestricted genomes are available for the general public
- 10. Once done click Next
- 11. Genome files themselves can be uploaded in this window using four different strategies: first, data can be uploaded directly from the Cyverse Data Store (if the data is not on the Data Store, it can be easily uploaded there afterwards once it has been included in CoGe); second, creating an HTP/FTTP link directly to the data; third, Upload the data from a private computer, and fourth, uploading the data using GenBank accession numbers. In the following example, the data will be uploaded using the Upload option.
- 12. Select the downloaded file and wait for the file to be read by CoGe. Once the file is read select Next.
- 13. Click Start on the next screen to begin upload.
- 14. Once the genome has been uploaded, all information included by the user, as well as any specifics regarding the genome FASTA file itself will be visible in the Genome Information page. Note that genomes in earlier stages of assembly (e.g. Scaffolds) can be uploaded into CoGe using these steps.

- 15. At this point, genome annotation files can be also uploaded into CoGe for the specified genome. These files can be included by clicking on the green Load Sequence Annotation button under the Sequence & Gene Annotation menu. Note that some limited analyses can be performed in CoGe even when genome annotation data is not yet available. Also, any specific upload can be updated at any point in time in CoGe. Thus, genome annotation data, metadata or experimental data can be included for the same genome in CoGe as soon as they become available.
- 16. The process to upload an annotation is similar to that of uploading genome. Under the Describe your annotation page, the user can select the version and source of the annotation data. After clicking Next, the data can be uploaded directly from the Cyverse Data Store, by creating an HTP/FTTP link directly to the data, or using the Upload option. Both GFF and GTF files are accepted when the genome annotation data is uploaded from a private computer. By clicking Next, the annotation data associated to the genome is uploaded and stored on CoGe. Now, the information should be visible under to Genome Information page under the Sequence & Gene Annotation menu. For more details about uploading genome annotation follow this link: LoadAnnotation

Importing genomes from using the "NCBI/Genebank" method
- Now, it is also possible to specifically upload chromosomes and organelles's genomes into CoGe. The following steps show how to upload individual chromosomes into CoGe:
- 1. In the lower part of the screen, find the Reference Genome section. The RefSeq and INSDC numbers for each chromosome can be found here.
- 2. Follow steps 3-10 from the previous section.

- 3. Select the GenBank accession numbers option. Type or Copy/Paste the INSDC numbers for each Plasmodium chromosome or for specific Plasmodium organelle genomes. After typing each number click the Get button. The uploaded genome should appear under Selected file(s). Once all the desired genomes have been uploaded select Next to begin the upload.
- 4. Once the genome has been uploaded, all information included by the user, as well as any specifics regarding the genome FASTA file itself will be visible in the Genome Information page. Note that uploading chromosomes/genomes using this method inputs information of genome annotation already included in GenBank. Also, notice that genomes uploaded using this method become public and are visible by all users of CoGe.
Exporting genomes from CoGe to Cyverse
- Data can be uploaded into Cyverse for easy sharing and storage once it has been uploaded into CoGe. This is highly recommended for complete and certified data. Using CoGe to upload data into the CyVerse data Store is remarkably simple:
- 1. While logged into CoGe, go to the Genome Information page of the genome you want to add.
- 2. Under the Tools menu, find the Export to CyVerse Data Store option. Click on FASTA and GFF to upload the genome and annotation, respectively. Make sure to provide any specifics when uploading the annotation data (GFF file).
- 3. Wait until the upload is completed. From this point forward, the data will be also found in the CyVerse Data Store. Note that no modification can be performed to the uploaded genomes at the moment, so is recommended to keep a list of the uploaded genome codes provided by CyVerse and their corresponding organism.
Using CoGe tools to perform comparative analyses
Analyzing GC content and other genomic properties (GenomeList)

One of the most interesting features in Plasmodium genomes is the change in GC content observed across species. While changes in GC content are also observed in other groups of organisms, the changes observed in Plasmodium have occurred in a remarkably short time spam in comparison to other groups. Species of the Laveranian subgenus are markedly GC poor compared to other Plasmodium species suggesting that AT richness is a trait unique of this clade. Evolutionary studies have inferred that the Plasmodium common ancestor might also had an AT rich genome, and the GC content increment observed in other Plasmodium species might be a derived trait [2]. Alternative, it is also possible that the AT richness might be a trait shared by the common ancestor of the Laveranian ancestor and not to the common ancestor of the genus. The evolution of the GC content change within the genus Plasmodium will be better answered when Plasmodium species belonging to clades ancestral to Laverania become fully sequences. Nonetheless, the current availability of a continuously increasing number of sequenced genomes makes possible to address this issue in more detail than in the past.
It is possible to calculate the GC content for each Plasmodium genome via the GenomeInfo section under genome information. For genomes uploaded using GenBank, this information will already be displayed on the page. Genomes uploaded from private computers or using other methods, as well as genomes in earlier stages of assembly, will not have this information on display from the start. However, simply clicking on %GC on the Length and/or Noncoding sequence lines under the Statistics tab these measures will be promptly calculated by CoGe.
A simpler method to comparatively assess GC content variations across genomes is by using GenomeList. This tool permits to upload one or more genomes of interest into a list and perform genome specific calculations for a variety of features: amino acid usage, codon usage, and genomic features and CDS GC content. In addition, this table also summarizes genome information included by the user: sequence type, sequence origin, taxonomy, provenance, version uploaded to CoGe, etc. Moreover, GenomeList can be used on genomes on earlier levels of assembly.
The following steps indicate how to perform comparative analyses using the GenomeList tool in CoGe:

1. Go to: https://genomevolution.org/coge/ and login into CoGe
2. In the main page of CoGe, find the Tools tile and click on to Organism View (https://genomevolution.org/coge/OrganismView.pl)
3. Type the scientific name of the organism of interest on the Search box and select the desired version of the uploaded genome.
4. Find the Genome Information tile on the right side of the screen. Under the Tools line find Add to GenomeList and click. This will automatically generate a new window where the selected genome has been added.
5. Without closing the window from step 4, type the scientific name of other organisms of interest on the same Search box used before. Once the second organism's genome has been selected, click on Add to GenomeList. The second select organism should appear on the small window. You can add as many organisms as desired.
6. Once all genomes have been selected click on the green Send to Genome list button.
7. After a couple of seconds, features and information for all included genomes will be available for comparison on GenomeList. While some information related to the nature of the upload itself, several columns provide the links to perform genome specific calculations. Note that by clicking on the Change Viewable Columns green button on the upper right part of the screen, is possible to select which columns are under display on the screen.
8. It is possible to download information from the selected genomes under a variety of formats using "Send Selected Genomes to". Note that the information downloaded will correspond to the genomes themselves and not to the calculations and analyses performed on GenomeList.
Identifying gene homologs (CoGeBlast)
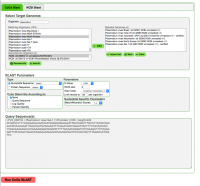
Genes belonging to the Plasmodium core genome are of enormous interest in the study of the genus evolution, as well as in the development of novel control and treatment strategies for Plasmodium. Alternatively, the study of multigene families and the loss/gain of paralogs across Plasmodium species provides a unique perspective to the rapidly changing Plasmodium genome. For instance, multigene families with a tandem arrangement in the chromosome can be easily associated with regions of microsynteny loss. Nonetheless, multigene families of mayor importance in Plasmodium evolution have far more complex patterns with paralogs being widespread across the parasite's genome. Particularly, families such as var, STEVOR, rifin, and vir (found in P. falciparum and P. vivax, and closely related species respectively) have fundamental roles in disease pathogenesis and immune evasion. [3][4][5][6] In this regard, tools which can identify orthologs and paralogs among various genomes are immensely in the study of Plasmodium evolution. One of these tools implemented in CoGe is CoGeBlast.
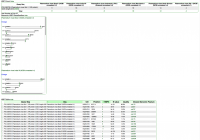
The telomeric vir multigene family represents one of the most diverse and complex multigene families described within the Plasmodium genus. [7][8] Moreover, the sequence variability within members of the vir family has resulted in 6 of the 32 vir paralogs being grouped into six different subfamilies or remain as singletons according to sequence similarity analyses. Therefore, finding members of the different vir subfamilies between Plasmodium strains can be a complex task.
The following steps show how to use CoGeBlast in the CoGe platform:
1. Go to: https://genomevolution.org/coge/ and login into CoGe
2. In the main CoGe page, find the Tools tile and click on to CoGeBlast (https://genomevolution.org/coge/CoGeBlast.pl)
3. Type the scientific name of the Organism of interest in the Select Target Genomes tile, when using the Search tab. Organisms which share the intended input will appear under the Matching Organisms menu.
4. Select all the organisms of interest by using Crtl+click or Command+click and then click on the green + Add button. The added organisms will appear on the Selected Genomes menu on the right.
5. Copy the query sequence in FASTA format on the Query Sequence(s) tile at the bottom of the screen. If desired, the BLAST analysis itself can be modified by changing the BLAST Parameters.
6. Once the analysis has been completed, SynMap will output a graphical depiction of the syntenic regions between the two genomes.
Results show that the number the vir multigene family members is largely variable across P. vivax strains (Results can be replicated following this link: https://genomevolution.org/r/lt61). Interestingly, within the analyzed subfamily, both the P. vivax PO1 and Sal-1 show the smallest number of paralogs while the strains India VII and Mauritania I showed the largest, this could suggest that the number of members of the vir multigene family can vary amongst P. vivax strains. Alternatively, such patterns could also be explained by different levels of sequence similarity in family members between different strains. This type of variation highlights the complex evolutionary patterns within this family, as well as could indicate a panorama of rapid sequence change leading to a immune evasion role unique to different P. vivax strains.
SynMap
Identifying syntenic genes between two Plasmodium genomes
One of the main purposes of SynMap si to identify syntenic orthologs between two species. This information can be used to identify syntenic orthologs or regions of interest across a larger number of species.
These steps show how to perform comparative analyses using the SynMap tool at CoGe:
1. Go to: https://genomevolution.org/coge/ and login into CoGe
2. On the main CoGe page, find the Tools tile and click on to Organism View (https://genomevolution.org/coge/OrganismView.pl)
3. Type the scientific name of the desired species on the Search box, and click on the GenomeInfo link under the Genome Information tile.
4. Find the SynMap link on the Analyze section of the Tools tile
5. By default, SynMap allows the user to compare the synteny of a genome with itself. This can be of great use to characterize a genome and perform rapid comparisons to detect and putatively time certain duplication events [9]. In this example however, the genomes of two different organisms will be analyzed. Different genomes can be selected for Organism 1 or 2 by typing the scientific name of the desired organism of either search box and then selecting the intended genome. A P. vivax genome has been selected to be analyze with P. cynomolgi. Once the organisms have been selected click on Generate SynMap
6. Once the analysis has been completed, SynMap will output a graphical depiction of the syntenic regions between the two genomes.
Comparing genomes to identify chromosomal inversions, fusions, fissions and other events

Initial studies on Apicomplexan genome architecture showed that synteny within the Plasmodium genus is highly maintained. However, the analysis of a larger number of Plasmodium species genomes led to the discovery of more complex patterns with closely related species showing conserved synteny, while synteny became largely variable across Plasmodium clades. [10] Now, with an ever growing Plasmodium panorama, is possible to assess the nature of synteny in an complex array of species in detail and within each mayor Plasmodium clade. The increasing number of sequenced Plasmodium genomes publicly available, make possible to estimate species-specific genomic rearrangements and even makes inferences regarding their significance on genome evolution. SynMap2 and SynMap Legacy can used to perform synteny analyses between two species. This information can be easily used to identify the nature and evolutionary origin of genomic rearrangement when several paired comparisons are performed.
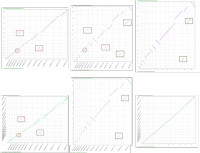
For example, events leading to the loss of synteny on chromosomes 3 and 6 have been reported between the closely related species: P. vivax, P. cynomolgi and P. knowlesi . A synteny analysis of these species using SynMap Legacy shows inversion events between P. vivax and both P. knowlesi and P. cynomolgi. Nonetheless, syntenic analyses between P. cynomolgi and P. knowlesi show no inversion events. This suggest that the chromosomal inversions reported for chromosomes 3 and 6 might have occurred after the split of P. cynomolgi and P. vivax approximately between 3.43-3.87 Mya and can be unique of the P. vivax genome. [11] Analyses can be regenerate following these links: https://genomevolution.org/r/lj12 (P. vivax vs. P. cynomolgi), https://genomevolution.org/r/lj1x (P. knowlesi vs. P. cynomolgi), and https://genomevolution.org/r/lj1t (P. knowlesi vs. P vivax).
It is also possible to identify sets of chromosome fusion/fision events unique to specific genomes. Pairwise comparisons between the genomes of four closely related Plasmodium parasites: P. ovale curtisi, P. malariae, P. coatneyi and P. knowlesi; show that at least two sets of inversions and fusions have occurred in the P. coatneyi and P. malariae genomes. SynMap Legacy results show two fusion events in chromosomes 5 and 9 unique to P. malariae (marked with red squares) and two additional fusion events in chromosomes 13 and 14 of P. coatneyi (marked with green squares). Moreover, and inversion event can be observed in the central region of chromosome 4 in P. malariae (marked with a red circle). Analyses can be regenerated using the following links: P. knowlesi vs. P. malariae (https://genomevolution.org/r/lq5x); P. coatneyi vs. P. knowlesi (https://genomevolution.org/r/lj2b); P. coatneyi vs. P. malariae (https://genomevolution.org/r/lq5y); P. ovale vs. P. malariae (https://genomevolution.org/r/lq5t); P.coatneyi vs. P. ovale (https://genomevolution.org/r/lq65); and P. ovale vs. P. knowlesi (https://genomevolution.org/r/lq5v).
Measuring Ks/Kn values between genomes (SynMap - CodeML analysis tool)

Ks/Kn analyses are largely used as a measure for the amount of evolutionary change occurring between homolog sequences; moreover, they provide a perspective on the role of Natural Selection and the overall mutability of a genome. While a variety of platforms allow the user to perform Ks/Kn analyses between groups of orthologs, these types of tools are commonly limited by the identification of homolog genes by the user and are performed without information of their relative position on the genome. By using SynMap before performing any Ks/Kn analysis, CoGe not only allows to test hypothesis regarding the evolution of genomes and the roles of Natural Selection, but it also provides information regarding the relative position of these changes across the genome. This is a highly informative aspect in comparative genomic, since different genome regions are likely to show different evolutionary patterns. This is a particular concern in the study of Plasmodium comparative genomics, since several studies have pointed out to the subtelomeric regions of the chromosomes as points for rapid genome evolution [12]. Ks/Kn analyses can be performed in CoGe by using one of the different SynMap tools and changing the Syntenic_dotplot display.

These steps show how to perform Ks/Kn analyses using the SynMap tool at CoGe:
1. Go to: https://genomevolution.org/coge/ and login into CoGe
2. Perform a SynMap analysis between to genomes of interest. Note that Ks/Kn analyses can be performed regardless of the genome's level of assembly, only annotated genomes (.gff files have been imported) can be used for this analysis.
3. Once the analysis has been completed and SynMap outputs a graphical depiction of the syntenic regions between the two genomes (shown in green in SynMap Legacy), is possible to perform the Ks/Kn analysis.
4. Find the Analysis Options tab at the bottom of the screen and find the CodeML tool on the six analysis tile from the top. Click on the Calculate syntenic CDS pairs and color dots:________ substitution rates(s) section and select Synonymous (Ks) from the dropdown menu. Alternative analysis can be performed by selecting the: Non-synonymous (Kn) and (Ks/Kn) analysis. It is also possible to modify some display options in this section by choosing a different Color Scheme from the second dropdown menu, or by specifying the axis default Min Val. or Max Val., and the Log10 Transform. of the data.
5. The resulting output will show the distribution of Ks values (or Kn or Ks/Kn) across the syntenic regions between the two evaluated genomes on SynMap. In addition, a Histogram of ks (or Kn or Ks/Kn) values will be included bellow the SynMap output. In SynMap2, specific regions/chromosomes can be selected to obtain a dynamic view of the Ks, Kn or Ks/Kn across the syntenic regions between the two analyzed genomes.
Smaller Log10( ) substitution per site values of ___ are indicative of a lower number of synonymous (Ks) or non-synonymous (Kn) substitution between the analyzed genomes. Since the effects of Natural Selection on synonymous substitutions is thought to be minimal, these types of substitutions are expected to accumulate in a largely constant manner. Therefore, paired Ks analyses performed between different groups of genomes can provide information regarding their time of divergence, and clues about their evolvability. The Ks analyses between P. gaboni and P. reichenowi show a larger number of recent synonymous substitution compared to the same analysis performed between P. gaboni and P. falciparum. This is an interesting result since, P. reichenowi and P. falciparum are thought to share a common ancestor that diverged from P. gaboni. Moreover, Ks values between P. reichenowi and P. falciparum show to be slightly larger than those observed in the P. reichenowi - P. gaboni comparison, despite them being sister species. This could suggest that syntenic genes within P. reichenowi could be evolving at a more rapid rate than other species within the subgenus. These analyses can be replicated in the following links: P. reichenowi vs. P. falciparum (https://genomevolution.org/r/ljhj), P. reichenowi vs. P. gaboni (https://genomevolution.org/r/ljhq), and P. falciparum vs. P. gaboni (https://genomevolution.org/r/ljhl).
Alternatively, the pattern of non-synonymous (Kn) substitution observed between P. gaboni - P. falciparum and P. gaboni - P. reichenowi seems to be quite similar in accordance to P. falciparum and P. reichenowi sharing a common ancestor with P. gaboni. These results show that Natural Selection has driven a number of substitutions before the split of these two species from P. gaboni. Moreover, a smaller yet more recent number of non-synonymous substitutions have occurred since the split of P. reichenowi and P. falciparum, potentially driving the further divergence of these species. Analyses can be run following these links: P. reichenowi vs. P. falciparum (https://genomevolution.org/r/lsz2), P. reichenowi vs. P. gaboni (https://genomevolution.org/r/lsyy), and P. falciparum vs. P. gaboni (https://genomevolution.org/r/lsz5).
Identifying sets of syntenic genes amongst several genomes (SynFind)
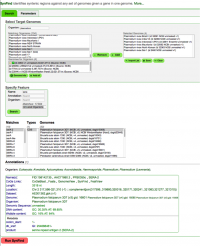
The SynFind tool found in CoGe allows the user to identify syntenic regions across any set of genomes by using an specified gene in a reference genome. In the following example, we will use SynFind to detect the syntenic orthologs of the SERA multigene family. SERA (serine repeat antigen) is one of the genus specific multigene families found in all Plasmodium species. Members or the SERA multigene family are characterized by encoding proteins with a papain-like cysteine protease motif [13]. While the functions of this multigene family members are largely unknown, they are expressed during various stages of the Plasmodium life cycle; moreover, one member of this family (SERA-5) which is produced during late trophozoite and schizont stages, has undergone phase Ib clinical trials as a potential vaccine candidate. [14] Numerous genus and species specific duplication events have been reported across numerous Plasmodium species; making this one of the most interesting multigene families in Plasmodium from an evolutionary perspective. Moreover, duplication events in this family are thought to have occurred in tandem, meaning the paralogs are likely to be found in adjacent regions of the same chromosome.
These steps show how to use SynFind to find specific genes selected from a reference genome in a number of other genomes:
1. Find the SynFind tool in CoGe or follow this link: (https://genomevolution.org/CoGe/SynFind.pl)
2. Type the scientific name of the Organism of interest in the Select Target Genomes tile, when using the Search tab. Organisms which share the intended input will appear under the Matching Organisms menu.
3. Select all the organisms of interest by using Crtl+click or Command+click and then click on the green + Add button. The added organisms will appear on the Selected Genomes menu on the right.
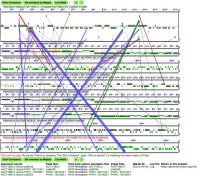
4. In the Specify Features tile, type the Name, Annotation or Organisms of interest. In this example, "sera" has been typed on the box corresponding to the Name. Then, click on the green Search button.
5. After a couple of seconds, all matches to the search word and their corresponding genomes will appear in a drop down menu. Select all matches of interest (in this case all SERA genes) and a reference genome (in this case the latest available version of P. falciparum strain 3D7).
6. Once all desired matches and genomes have been specified, click on the red Run SynFind button. This analysis can be regenerated using the following link: https://genomevolution.org/r/lszj
7. SynFind will output all regions which are syntenic to the query region on the reference genome. From this point, SynFind can also generate SynMap dotplots to all resulting matches or link to the microsyntenic analysis of these regions using GEvo. In addition, SynFind also calculated the Syntenic depth for each matching genome region.
The information provided by the SynFind and the Syntenic Depth analysis allow to rapidly identify all potential regions which can contain a multigene family paralog. Multigene families are commonly characterized by members which share family common motifs; nonetheless, these types of motif can be also shared by genes outside the multigene family of interest. In addition, while many families are found in a tandem arrangement in the genome, numerous multigene families of interest have members distributed across the entire genome. Therefore, tools which permit to count the number of instances in which a specific syntenic region is found across a number of genomes can be used in the identification and characterization of multigene family members. Nonetheless, potential syntenic regions should be carefully evaluated by the user in order to assess their potential biological significance. Given that particular motifs and domains can be conserved across a variety of genes and intergenic regions which might not share the same evolutionary origins than the ones of interest, potential hits provided by SynFind should be evaluated with critical eye.
Identifying codon and amino acid substitution frequencies (CodeOn)
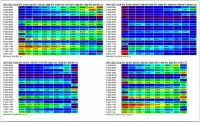
The changes in GC content observed in parasites of the genus Plasmodium have enormous implication on codon and amino acid usage. For one, the compositional bias observed on P. falciparum has been related to codon usage and gene expression, with many highly-expressed genes having a apparent preference for C-ended codons. Moreover, such patterns could also be related to the use of energetically less expensive amino acids. [15]. Thus, the unique compositional bias of Plasmodium species from the Laveranian sub genus could also point out to another degree for differences in energy consumption and in evolutionary paths across species. Furthermore, differences in codon usage could also be related to variations in transcriptional and mutational pressures across genomes, such as those reported in certain filarial nematodes[16]. Tools within CoGe allow the user to explore the changes in GC content and their significance in codon usage in novel and unique way. Specifically, CodeOn allow the user to observe the amino acid usage table en relation to the overall GC content of CDS.
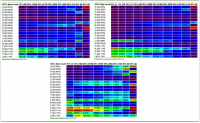
The following steps indicate how to built a AA usage table for any given genome:
1. Go to: https://genomevolution.org/coge/ and login into CoGe
2. Find your organism and genome of interest in Organism View (https://genomevolution.org/coge/OrganismView.pl)
3. Find the Genome Information tile on the right side of the screen. Under the Tools line find CodeOn and click. This analysis might take a couple of minutes, the output will be shown in a different tab on your browser.
Comparative analysis performed between P. vivax and P. knowlesi have shown that genes in GC rich regions evolve faster than genes in syntenic AT rich regions. [17] This suggest that GC content changes are not uniquely observed between Plasmodium species from different clades, and they can also play a part on the heterogeneous mutation rate observed across Plasmodium genomes. CodeOn results show that the patterns of amino acid usage and the variations on GC content are unique for each Plasmodium species. GC content varies slightly between species, with P. vivax showing a more even number of CDS with 45-55% GC content while the other species have a more skewed GC content of 40-45% on most CDS. Furthermore, despite similarities in GC content across the genome, amino acid usage is quite variable across species. As expected, Plasmodium species of the Laveranian subgenus show a larger number of CDS with reduced GC content (20-30%). Moreover, variation on the amino acid usage tables observed in P. gaboni, an earlier divergent species from P. falciparum and P. reichenowi, suggests that some unique usage features have evolved on the common P. falciparum-P. reichenowi ancestor.
Using Syntenic Path Assembly (SPA) to make analysis of poor or early genome assemblies easier (SynMap - SPA tool)

While the Plasmodium genome panorama has become more complete in recent years, there are still a large number of incomplete Plasmodium genomes. These genomes can originate from three different sources: poorly sequenced or assembled genomes, sequencing project where genomic information is published in its earlier stages of assembly, or genomes from private sources that remain to be assembled. Moreover, the number of repetitive sequence and multigene families found in Plasmodium can vary largely between species and between regions, making complete genome assembly a challenging task even for nobel sequencing techniques. [18]
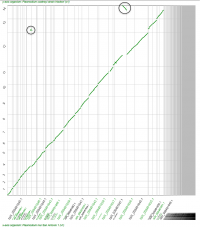
Though the number of analyses that can be performed using poor genome assemblies can be somehow limited, various techniques can be employed to identify syntenic orthologs or even gene duplicated in these genomes. One of the tools provided by CoGe is the Syntenic_path_assembly or SPA, which provides a quick genome assembly using any selected reference genome. Therefore, in order for the SPA to be effective a complete genome should be used alongside the poorly assembled one. Additionally, SPA also allows the user to correctly project syntenic regions across chromosomes annotated using reverse DNA strands.
The SPA tool can be easily used in CoGe by following these steps:
1. Go to: https://genomevolution.org/coge/ and login into CoGe
2. Run SynMap between a completely sequence genome and one with poor genome assembly following the previously available instructions.
3. Once the SynMap has been generated find the Display Options tab. In the bottom of the screen, the SPA tool can be selected by clicking on the check mark next to: The Syntenic Path Assembly (SPA)?
4. After a few minutes (depending of the number of contigs), the incomplete genome will be assembled using the second genome as a reference.
Note that while using SPA allows to gather a degree of syntenic information between the two genomes there are certain limitations. For instance, great care should given when inversion or duplication events are identified using this tool. Shown in the figure, there are two potentially misidentified events: a "gene duplication" and a "genomic inversion" (both shown as Black circles). In both cases the incomplete genome assemble of P. inui prevents to identify these events. Respectively, various contigs can potentially be syntenic to a same region and contigs could have been annotated using a reverse DNA strand, showing patterns similar to duplication and inversion events. This analysis can be replicated using the following link: https://genomevolution.org/r/ljen
Identifying microsyntenic regions (GEvo)
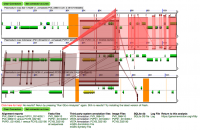
Comparative analysis within Plasmodium species show that microsynteny tends to be loss in certain regions even among closely related species. Many regions of microsynteny loss are commonly associated with the presence of Low Complexity Regions (LCR), regions of higher recombination rates or with the location of multigene families. Therefore, this regions can represent a high point of interest within evolutionary analysis directed to Plasmodium. While larger trends in synteny between genomes can be analyzed using SynMap, GEvo allows for the assessment of these regions between two or more genomes. Thus, regions where synteny is loss between two genomes can be identified using SynMap and then further analyses using GEvo.

The following steps show how to analyze a microsyntenic regions using GEvo:
1. Go to: https://genomevolution.org/coge/ and login into CoGe
2. Run SynMap between two sequences of interest.
3. A syntenic pair of genes can be identified in SynMap Legacy or in SynMap2 by zooming on the region of interest and then selecting the gene pair of interest. Once a single gene has been selected, click on GEvo to perform the microsyntenic analysis.
Syntenic regions in GEvo can be highlighted by using different colored connector. By default, syntenic regions between the genomes are connected in red. In the first analysis, the microsynteny between two P. vivax strains (PO1 and Sal-1) is being evaluated. The results show a loss of synteny between these strains which correlated with the location of a poorly sequence region found in the P. vivax Sal-1 strain and P. cynomolgi (shown in orange). The loss of synteny event can be associated with a putative chromosomal inversion observed in the P. vivax Sal-1 strain. The loss of synteny can be also observed when the P. vivax Sal-1 strain is analyzed respect to its sister taxa P. cynomolgi. Moreover, the analysis also shows that synteny is maintained in the same region between P. cynomolgi and the P. vivax PO1 strain, suggesting that the inversion event is unique to the P. vivax Sal-1 strain. Analysis can be rerun following this link: https://genomevolution.org/r/lt6y
GEvo can also be used to evaluate microsynteny in block known to contains multigene families. The analysis shows variations in the level of synteny conservation across five P. vivax strains obtained from various geographic regions (analysis can be rerun following this link: https://genomevolution.org/r/lszj). Connected are the 12 reported paralogs for the SERA multigene family described in P. vivax. [19] The microsynteny analysis not only shows a hight level of similarity across same-strain and different-strain paralogs, as expected from a multigene family, but it also shows marked loss of synteny on the P. vivax Brazil-1 strain (shown as second from the upper part of the screen) respect to the other analyzed strains. Moreover, the location of these apparent loss of synteny events are shown no coincide with paralogs known to be found only in P. vivax and closely related species. This suggest that the number of the SERA multigene family members might be variable even at an interspecific level, such as it has been reported for other Plasmodium multigene families. [20]
MENCIONAR BLAST AGAIN
Useful links
Plasmodium Notebooks in CoGe:
Link to Notebook for published Plasmodium genome data: https://genomevolution.org/coge/NotebookView.pl?lid=1753
Link to Notebook for published P. falciparum strains: https://genomevolution.org/coge/NotebookView.pl?lid=1758
Link to Notebook for published P. vivax strains: https://genomevolution.org/coge/NotebookView.pl?lid=1760
Link to Notebook for published Plasmodium apicoplast data: https://genomevolution.org/coge/NotebookView.pl?lid=1754
Link to Notebook for published Plasmodium mitochondrion data: https://genomevolution.org/coge/NotebookView.pl?lid=1756
References
- ↑ Carlton JM, Perkins SL, Deitsch KW (2013) "Malaria parasites comparative genomics evolution and molecular biology" Caister Academic Press
- ↑ Nikbakht H, Xia X, Hickey DA. 2014. The evolution of genomic GC content undergoes a rapid reversal within the genus Plasmodium. Genome. 9:507-511. https://www.ncbi.nlm.nih.gov/pubmed/25633864
- ↑ Niang M, Yan Yam X, Preiser PR. 2009. The Plasmodium falciparum STEVOR multigene family mediates antigenic variation of the infected erythrocyte. PLoS Pathog. 5:e1000307. https://www.ncbi.nlm.nih.gov/pubmed/19229319
- ↑ Witmer K, Schmid CD, Brancucci NM, Luah YH, Preiser PR, Bozdech Z, Voss TS. 2012. Analysis of subtelomeric virulence gene families in Plasmodium falciparum by comparative transcriptional profiling. Mol Microbiol. 84:243-59. https://www.ncbi.nlm.nih.gov/pmc/articles/PMC3491689/
- ↑ Petter M, Bonow I, Klinkert MQ. 2008. Diverse expression patterns of subgroups of the rif multigene family during Plasmodium falciparum gametocytogenesis. PLoS One. 3:e3779. http://journals.plos.org/plosone/article?id=10.1371/journal.pone.0003779
- ↑ Singh V, Gupta P, Pande V. 2014. Revisiting the multigene families: Plasmodium var and vir genes. J Vector Borne Dis. 51:75-81. https://www.ncbi.nlm.nih.gov/pubmed/24947212
- ↑ Fernandez-Becerra C, Yamamoto MM, Vêncio RZ, Lacerda M, Rosanas-Urgell A, del Portillo HA. 2009. Plasmodium vivax and the importance of the subtelomeric multigene vir superfamily. Trends Parasitol. 2009 25:44-51. https://www.ncbi.nlm.nih.gov/pubmed/19036639
- ↑ Lopez FJ, Bernabeu M, Fernandez-Becerra C, del Portillo HA. 2013. A new computational approach redefines the subtelomeric vir superfamily of Plasmodium vivax. BMC Genomics. 14:8. https://www.ncbi.nlm.nih.gov/pubmed/?term=A+new+computational+approach+redefines+the+subtelomeric+vir+superfamily+of+Plasmodium+vivax
- ↑ https://www.ncbi.nlm.nih.gov/pmc/articles/PMC3408644/
- ↑ Tachibana SI, Sullivan SA, Kawai S, Nakamura S, Kim HR, Goto N, Arisue N, Palacpac NM, Honma H, Yagi M, Tougan T, Katakai Y, Kaneko O, Mita T, Kita K, Yasutomi Y, Sutton PL, Shakhbatyan R, Horii T, Yasunaga T, Barnwell JB, Escalante AA, Carlton JM, Tanabe K. 2012. Plasmodium cynomolgi genome sequences provide insight into Plasmodium vivax and the monkey malaria clade. Nat Genet. 44: 1051–1055. https://www.ncbi.nlm.nih.gov/pmc/articles/PMC3759362/
- ↑ Pacheco MA, Reid MJ, Schillaci MA, Lowenberger CA, Galdikas BM, Jones-Engel L, Escalante AA. 2012. The origin of malarial parasites in orangutans. PLoS One. 7:e34990. https://www.ncbi.nlm.nih.gov/pubmed/22536346
- ↑ Lau AO. 2009. An overview of the Babesia, Plasmodium and Theileria genomes: A comparative perspective. Mol Biochem Parasitol. 164:1-8. http://www.sciencedirect.com/science/article/pii/S016668510800279X
- ↑ Arisue N, Kawai S, Hirai M, Palacpac NM, Jia M, Kaneko A, Tanabe K, Horii T. 2011. Clues to Evolution of the SERA Multigene Family in 18 Plasmodium Species. PLoS One. 6: e17775. http://journals.plos.org/plosone/article?id=10.1371/journal.pone.0017775
- ↑ Arisue N, Hirai M, Arai M, Matsuoka H, Horii T. 2007. Phylogeny and evolution of the SERA multigene family in the genus Plasmodium. J Mol Evol. 65:82-91. http://link.springer.com/article/10.1007%2Fs00239-006-0253-1
- ↑ https://www.cambridge.org/core/services/aop-cambridge-core/content/view/S0031182003004517
- ↑ https://www.researchgate.net/publication/300074990_Expression_levels_and_codon_usage_patterns_in_nuclear_genes_of_the_filarial_nematode_Wucheraria_bancrofti_and_the_blood_fluke_Schistosoma_haematobium
- ↑ Carlton JM, Escalante AA, Neafsey D, Volkman SK. 2008. Comparative evolutionary genomics of human malaria parasites. Trends in Parasitology. 24: 545–550. http://www.sciencedirect.com/science/article/pii/S1471492208002341
- ↑ Chien JT, Pakala SB, Geraldo JA, Lapp SA, Humphrey JC, Barnwell JW, Kissinger JC, Galinski MR. 2016. High-Quality Genome Assembly and Annotation for Plasmodium coatneyi, Generated Using Single-Molecule Real-Time PacBio Technology. Genome Announc. 4: e00883-16. https://www.ncbi.nlm.nih.gov/pubmed/27587810
- ↑ Arisue N, Kawai S, Hirai M, Palacpac NM, Jia M, Kaneko A, Tanabe K, Horii T. 2011. Clues to Evolution of the SERA Multigene Family in 18 Plasmodium Species. PLoS One. 6: e17775. http://journals.plos.org/plosone/article?id=10.1371/journal.pone.0017775
- ↑ Rice BL, Acosta MM, Pacheco MA, Carlton JM, Barnwell JW, Escalante AA. 2014. The origin and diversification of the merozoite surface protein 3 (msp3) multi-gene family in Plasmodium vivax and related parasites. Mol Phylogenet Evol. 78:172-84. https://www.ncbi.nlm.nih.gov/pubmed/24862221
