Using CoGe for the analysis of Plasmodium spp
About this Guide
Welcome to the Plasmodium genus genome analysis with CoGe guide. This 'cookbook' style document is meant to provide an introduction to many of our tools and services, and is structured around a case study of investigating genome evolution of the malaria-causing Plasmodium spp. The small size and unique features of this pathogen's genome make it a great example for beginning to understand how our tools can be used to conduct comparative genomic analyses and uncover meaningful discoveries.
Through a number of guided examples, this guide will teach users how to use the following tools:
- LoadGenome: Add a new genome to CoGe
- LoadAnnotation: Add structural annotations to a genome
- GenomeInfo: Get information about a genome
- GenomeList: Get information about several genomes
- CoGeBLAST: Blast against any set of genomes
- GEvo: Microsynteny analysis
- SynMap: Whole genome syntenic analysis
- - Kn/Ks analysis: characterize the evolution of populations of genes
- - SPA tool: Syntenic Path Assembly to assist in genome analysis
- SynFind: Identify syntenic genes across multiple genomes
- CodeOn: Characterize patterns of codon and animo acid evolution in coding sequence
A brief introduction to Plasmodium genome evolution
The unique features found in many parasitic genomes create singular challenges when studying their evolution via comparative genomics. Parasite genomes are characterized by a mixture of genome reduction associated with gene loss (e.g. homeobox genes), but also for the development of specialized genes. Many of the genes gained in parasitic genomes are involved in different aspects of host-parasite interaction and are, for the most part, species or lineage specific [1]. This dynamic nature of parasitic genomes is especially evident within the phylum Apicomplexa, and particularly within the genus Plasmodium. A marked loss of synteny between different Apicomplexa genera has been previously reported [2], although syntenic relationships between species within a single genus are largely conserved. While this finding remains true for many genera, the increasing number of sequenced Plasmodium genomes has shown that numerous clade and species-specific gain/loss events and chromosome rearrangements have occurred [3]. The exact origins and mechanisms of these rearrangements remains largely unexplored, but they are generally hypothesized to stem from different host shift events [4][5], which have led to diverse types of host-parasite interactions.
Despite the enormous diversity of Plasmodium parasites, all studies to date (2016) show conservation of certain genomic characteristics. Fourteen chromosomes, a mitochondrial, and an apicoplast compose the entire repertoire of the Plasmodium genome in all sequenced species. This conservation in genomic complement is remarkable, especially considering the potential for altering the number of chromosomes without compromising genome size. As in the case of other parasites, Plasmodium genomes are relatively small (between 17-28Mb approximately) in comparison to those of the hosts (1Gb for birds; 2-3Gb for mammals), but larger than those of other Apicomplexan parasites (Theileria orientalis and Cryptosporidium parvum have genomes of approximately 9Mb) [6]. All Plasmodium species have a complex life cycle involving some kind of vertebrate host and a mosquito vector of the genus Anopheles (mammals) or Culex (birds). Though host and vector preferences differ among species within the genus [7], all Plasmodium species share similar life cycle characteristics, which suggests the existence of a set of preserved core genes. These core genes are pivotal elements for the use of comparative genomics for studying Plasmodium evolution.
An increase in funding devoted to malaria research during recent years has come hand in hand with increased understanding of Plasmodium genetics [8]. At the moment, there is an unprecedented amount of Plasmodium genomes and gene sequences publicly available. The most prominent repository is found in NCBI/Genbank [9]; while additional and unique sequences can also be found on other databases: PlasmoDB, GeneDB and MalAvi [10][11][12]. The availability of genomic data from Plasmodium species opens the possibility to:
- Identify the likely origin of certain traits, specialized phenotypes, and genomic landscapes.
- Track the maintenance of conserved genes across the genus, as well as the rise and loss of genes unique to only a single or a group of closely related species.
- Infer the potential historical interactions which might have lead to the development of adaptations as well as their putative consequences.
One of the many remarkable trends of Plasmodium genome evolution is the rapid change in GC content. P. falciparum and closely related parasites have a remarkably AT rich genome compared to other Plasmodium species [13]. While significant shifts in GC content have been reported in other parts of the tree of life such as Bacteria [14][15] and monocots [16], the short evolutionary time during in which this change has occurred in Plasmodium is noteworthy. Moreover, the GC content variability observed amongst Plasmodium species has not yet been observed in other Apicomplexan genera. AT rich genomes not only present challenges for sequencing [17], but they result in entirely different trends of codon and amino acid usage. Furthermore, patterns of genome mutability and in the evolution of repetitive elements can also be markedly different in AT rich genomes. By utilizing various analysis tools for comparative genomics, it is possible to assess the evolutionary origins and trace patterns of GC content shift across the Plasmodium genus.
Another important aspect in Plasmodium evolution is the unique patterns of genome variability and the diverse responses to selective pressures observed in different Plasmodium genomes. In this regard, comparative genomic analyses between Plasmodium species and strains can elucidate the genetic elements behind these differences (e.g. different hosts pressures). Perhaps more significantly in Plasmodium evolution, and of parasites in general [18], is identifying the origin and evolution of multigene families. Within the Plasmodium genome, numerous multigene families show specific gene gain/loss events, which can be associated to variable genomic regions. The differences in the ancestry of these families is also noteworthy, with many being observed only in a single Plasmodium species or among closely related species, and others being observed across the entire Plasmodium genus but not in other Apicomplexa parasites [19]. In this sense, each multigene family can illustrate a different aspect of the evolutionary history of the genus and the adaptation of Plasmodia to their hosts and vectors.
In the following paper, we will demonstrate how to use the CoGe platform to analyze Plasmodium genomes and evaluate diverse evolutionary hypotheses. Through a case study on Plasmodium evolution, we will illustrate how CoGe can be used for the analysis of multigene families, local synteny, and whole genome comparisons (genome composition, rearrangement events, and conservation).
Finding genomes in CoGe and integrating new genomes
An increasing number of Plasmodium genomes have been sequenced in recent years. Furthermore, the amount of genomic data available for the genus will likely continue to increase. Tools that permit rapid integration of genomic information and its subsequent analysis are essential for Plasmodium research. Specifically, online platforms which aid in reducing computational time, costs, and foment collaboration initiatives worldwide are of particular interest in the study of malaria.
The first step in analyzing Plasmodium genomes with CoGe is determining which genomes are already included in the data repository.
Finding about the Plasmodium genomes already present in CoGe

While the amount of Plasmodium genomic data has significantly risen during the past few years, important advances in Plasmodium genomics have been occurring for approximately 20 decades. Thus, there exists an extensive amount of historical genomic data for this genus.
For example, a significant accomplishments in the study of Plasmodium genomics was the full sequencing and assembly of the P. falciparum genome [20]. Subsequent technological improvements lead to re-annotation and re-evaluation of this genome. CoGe’s repositories contain these different evaluations and annotations as uniquely named genome versions. This happens because the CoGe platform incorporates new versions of a genome without removing previous ones. Thus, you can find the original P. falciparum sequenced genome as well as posterior re-annotations and re-evaluations.
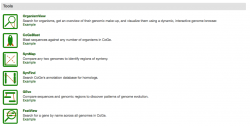
Before importing a genome into CoGe, and to prevent redundancy of genomic information, it is recommended to identify what Plasmodium genomic data has already been incorporated (Figure 1). You can search CoGe’s Plasmodium genomes by typing the word "Plasmodium" into the Search bar at the top of most pages. This will retrieve all organisms and genomes with names matching the search term. Clicking on any organisms will produce the details of the upload. Alternatively, you can find the Tools section on the main CoGe page and click on to Organism View (https://genomevolution.org/coge/OrganismView.pl).
All publicly available genomes imported into CoGe, and their corresponding metadata, can be found in the Organism View section (Figure 2). To find any genome on Organism View, type a scientific name into the Search box. You will find the following information (Figure 3):
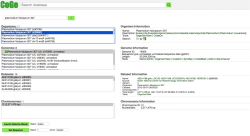
- Organisms: In the case of Plasmodium spp., the different parasitic strains already imported. Also, any imported organelle genomes (mitochondrial and apicoplast).
- Organism Information: An outline of the organisms’ taxonomy (as published on NCBI/Genbank). This section also includes links to some of CoGe's main analysis tools.
- Genomes: All genome versions available. Note that by selecting different genome versions, all associated genomic information changes.
- Genome information: Includes genome IDs, type of sequences uploaded, and sequence length. You can also access CoGe's genome analysis tools in this section.
- Datasets: This section includes the number of datasets for the specified genome. In the case of completely sequenced genomes imported from NCBI/GenBank it will indicate the chromosome’s accession numbers.
- Dataset information: Provides information for each dataset including: accession numbers (if available), source of the import, chromosome length, and GC%.
- Chromosomes: Shows the number of chromosome in the selected genome. However, depending of the method used to import the genome into CoGe and the dataset itself, the number and length of the chromosomes will vary (e.g. number of contigs not chromosomes).
- Chromosome information: Shows each chromosome's ID and number of base pairs (bp).
You can find a more detailed description of any genome by accessing the Genome Info section within Genome Information. You can also access links to the majority of CoGe’s comparative analysis tools in this section. Keep in mind that genomes imported to CoGe can have a “Public” or “Restricted” display. Genomes made “Public” can be seen and analyzed by anyone using the CoGe platform. On the other hand, “Restricted” genomes can only be seen and/or analyzed by the user and/or those with whom they shared the information (Sharing_data).
Importing Plasmodium genomes into CoGe
If a genome is not found on CoGe's repository then it should be imported before analysis. Genomic data can be imported into CoGe using a variety of methods. We will focus on two methods most likely to be used when importing Plasmodium genomes. For additional information about other methods please check How_to_load_genomes_into_CoGe. Depending on your intended analyses, you might want to use a complete Plasmodium genome, a specific chromosome, or focus in an organelle. The methods described here can be used to upload either data. To import a genome onto CoGe follow these steps:
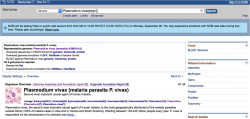
- 1. Go to the genome database on NCBI/GenBank and type "Plasmodium" on the search box. You can use any other database as well.
- 2. In the Representative Genome section you will find links to Download Sequences in FASTA format and Download Genome Annotation (Figure 4).
- - To download a complete Plasmodium genome click on Genome under Download Sequences in FASTA.
- - To download a complete annotation for a Plasmodium genome click on GFF under Download Genome Annotation.
- You can also download single chromosome’s and, if available, organelle’s genomes by clicking on the RefSeq or INSDC numbers.
- 3. Go to CoGe and login. You can follow this link: https://genomevolution.org/coge/
- 4. Click on MyData to reach the Data section of your personal CoGe page (Figure 5). This section will fill up as you import genomes into CoGe.
- 5. Click on NEW and select New Genome from the dropdown menu.
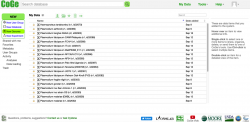
- 6. You will input information about the organisms' taxonomy and the genome's origin on the Create a New Genome window (Figure 6). Keep in mind that taxonomic information for that genome might not have been incorporated into CoGe yet. If this is the case, follow these steps to create a "new organism":
- a. Click on NEW on the "Organism:" section.
- b. Type the scientific name of the organism to be imported on the Search NCBI box. If the organism does not show up select its closest taxonomic relative. In the case of Plasmodium, several strains might be available for a given species (particularly P. vivax and P. falciparum). Make sure to select the correct strain or, if a new strain is being imported, to add its’ name.
- c. Click Create.
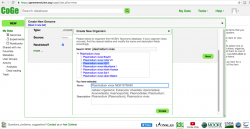
- 7. After creating a new strain/genome, you must also include any other metadata. Type the import's genome version in Version. Remember to check which genomes are already available on CoGe and their versions. If this if the first genome imported, the version number should be “1”. Select the sequence type from the drop down menu on the Type section (most sequences can be identified as unmasked, Masked). Select the Source in the next dropdown menu (in this case the source is NCBI). Finally, tick the check box if you desire your genome to be Restricted. Remember that:
- - Restricted genomes can only be seen and analyzed by the user and those with whom they have shared the genome.
- - Public genomes are available to anybody using CoGe.
- 8. Click Next.
- 9. You can import genome files using four different strategies: first, the data can be imported directly from the Cyverse Data Store; second, a HTP/FTTP link directly to the data can be created; third, the data can be imported from a private computer using Upload; and fourth, the data can be imported using GenBank accession numbers.
- To import genomes using Upload:
- a. Select a genome file downloaded from your local computer and wait for it to be read by CoGe, once the process is completed select Next. Note that you should select a FASTA, FST or FAA file.
- b. Click Start to begin the import.
- c. Once concluded, the file’s metadata will be visible in the Genome Information page.
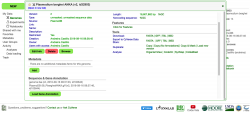
- d. At this point, you can import any genome annotation data. To do so, click on Load Sequence Annotation under the Sequence & Gene Annotation menu. Note that any upload can be updated at any point in time if additional data becomes available. Thus, genome annotations or experimental data can be later added to any genome already in CoGe.
- e. In the Describe your annotation page, select the version and source of the annotation data and click Next. The data can be uploaded directly from the Cyverse Data Store, by creating a HTP/FTTP link, or by using the Upload option. Once concluded, the genome annotation should be visible on the Genome Information page under the Sequence & Gene Annotation menu (Figure 7). For more details about uploading genome annotations please check LoadAnnotation.
- To import genomes using NCBI/Genebank:
- a. Select the GenBank accession numbers option. Type or Copy/Paste the INSDC numbers for each chromosome or organelles and click Get. Information from each imported genome should appear under Selected file(s). Once all genomes have been imported (14 chromosomes in the case of Plasmodium), click on Next.
- b. Once concluded, the file’s metadata will be visible in the Genome Information page. Note that uploading chromosomes/genomes using this method also imports genome annotations already included in NCBI/GenBank. Also note that genomes uploaded using this method will be automatically made “Public”.
Exporting genomes from CoGe to Cyverse
- Data can be exported into Cyverse for easy sharing and storage after it has been imported onto CoGe. While this is not required to use any of CoGe's tools, it is a highly recommended step for any genome. You can export data into the CyVerse Data Store from CoGe by following these steps:
- 1. While logged into CoGe, go to the genome's Genome Information page.
- 2. Under the Tools menu, find the Export to CyVerse Data Store option. Click either on the FASTA or the GFF file options to upload genomic data and/or its annotation. Make sure to specify a name for the GFF file before performing the export. FASTA file names are automatically generated.
- 3. Wait until the export is completed. From this point forward, your FASTA and GFF files will also be found in the CyVerse Data Store. Note that no modification can be performed to the uploaded genomes, so it is recommended to link any generated FASTA file name to its corresponding species and/or strain.
Using CoGe tools to perform comparative analyses
Analyzing GC content and other genomic properties (GenomeList)
There are significant variations on average GC content and GC content distribution between the two main agents of human malaria: P. vivax and P. falciparum. In P. vivax, the average GC content is 42.3% while in P. falciparum is 19.4%. GC poor regions are mostly located on P.vivax’s subtelomeres, but they are widespread across the entire P. falciparum genome [21]. It is thought that GC content has shifted from an AT rich ancestor to GC rich extant species [22]. Thanks to the increasing number of fully sequenced Plasmodium genomes, we can evaluate the patterns of GC content variation across three of the four main described Plasmodium clades.
CoGe can calculate GC content by using the GenomeInfo tool. To calculate GC content, click on %GC under the Length and/or Noncoding sequence sections on the Statistics tab (for some genomes, this will already be shown).

You can compare and contrast GC content (and other genomic features) across several species and/or strains using GenomeList. This tool creates a list of genomes selected by the user and calculates features such as: amino acid usage, codon usage, CDS GC content, number of genes, and number of introns. GenomeList also summarizes the metadata for the genome including: sequence type, sequence origin, taxonomy, provenance, version uploaded to CoGe, etc.

| The following steps indicate how to perform comparative analyses using the GenomeList tool in CoGe:
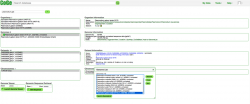
2. Click on Organism View or follow this link: https://genomevolution.org/coge/OrganismView.pl 3. Type the scientific name of any organism of interest on the Search box. Then, select a genome version. 4. Find the Tools section under Genome Information. Click on Add to GenomeList. The first genome added to GenomeList will appear in a new window. 5. Without closing this window, type the scientific name of another organisms on the Search box. Select the genome version and click on Add to GenomeList. 6. Once you have added all genomes click on Send to GenomeList (Figure 8). 7. GenomeList will generate a table including all the selected genomes. You can use GenomeList to select and compare different genomic features. You can calculate acid composition, %AT, %GC, and other genome attributes as well. The analyses can be run in specific genomes or in all the genome included on GenomeList. You can also select the columns on display by clicking on Change Viewable Columns (Figure 9). 8. You can download the genomes included on GenomeList by clicking on "Send Selected Genomes to".
|
Comparing genomic composition sequence: GenomeList
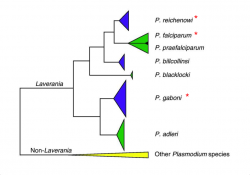
We used GenomeList to compare 12 fully sequenced Plasmodium genomes. Our results show that species closely related to P. falciparum (subgenus Laverania) have similarly AT rich genomes. GC content was higher on Plasmodium species of the simian and rodent clades (Figure 10). The highest GC content values were observed in species of the simian clade; particularly, in recently divergent species (P. vivax, P. cynomolgi and P. knowlesi). GC content varied across Plasmodium species infecting humans (P. vivax, P. ovale, P. malariae, and P. falciparum) but not on species infecting rodents (P. berghei, P. chabaudi, and P. yoelii). Moreover, GC content also varied in human-infecting Plasmodium from the same clade (P. vivax = 46.89%, P. ovale = 32.83%, and P. malariae = 25.12%). Our results show that GC content has steadily increased on the genus Plasmodium from ancestral to derived clades. GC content also increased from ancestral to recently divergent species within the subgenus Laveranian and the simian clade. These results indicate that GC content might be largely influenced by evolutionary relations and not so much by host-related selective pressures.
The AT richness of the Laveranian genomes is an unusual trait since Apicomplexas parasites frequently have GC rich genomes (Toxoplasma gondii = 52.28%, Cryptosporidium parvum = 30.4%, C. muris = 28.5%, Theileria orientalis = 41.58%, T. equii = 39.47%, Babesia bovis = 36.3%, Eimeria tenella = 51.07%, etc) It appears that Plasmodium GC content is in the process of being reinstated to values that can be considered typical for the phylum. There is some speculation regarding the mechanisms behind the increase in GC content [24]. However the evolutionary consequences of this increment and the reasons behind its ancestral drop after the split of the Plasmodium genus remain unknown.
Identifying gene homologs (CoGeBLAST)
The identification of homology between two sequences is key to gaining insight into organism’s biology and genetics. In comparative genomics, the identification of these relationships is particularly challenging when dealing with multigene families. Plasmodium multigene families perform a wide array of functions, have diverse gene organization, and distinct evolutionary patterns. Subtelomeric families involved in immune evasion and cell invasion (var, stevor, rifin in P. falciparum and vir on P. vivax) have some of the most complex evolutionary patterns and organizations. These families also undergo rapid sequence evolution [25][26][27][28]. The combination of all these factors complicate the analysis of Plasmodium subtelomeric families (identifying ortholog/paralog relations, gene gain/loss events, etc.).
In P. vivax, the 313 members on the vir family are grouped into 10 subfamilies based on sequence similarity. Gene size and structure (number of exons) is largely variable among family members [29][30][31]. Moreover, the genetic diversity in the vir family is larger than that of other P. vivax families. Only fifteen vir genes are shared across all sequenced P. vivax strains. The genetic diversity of these 15 genes is lower than that of other vir family members. Within this group, PVX_113230 has been proposed as a potential founder of the family based on its high sequence conservation [32].
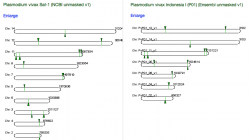
We will used CoGeBLAST to find the proposed founder of the Plasmodium vir family (PVX_113230) on six P. vivax strains (including the recently sequenced PO1 strain). CoGeBLAST incorporates visualization into BLAST analyses. Therefore, this tool facilitates the study of complex evolutionary patterns.
| The following steps show how to use CoGeBLAST in the CoGe platform:
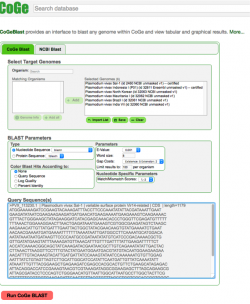
2. Click on CoGeBLAST or follow this link: https://genomevolution.org/coge/CoGeBlast.pl 3. Type the scientific name of the Organism of interest on the Search box. All genomes with names matching the search term will appear under the Matching Organisms menu. Also, any Notebooks matching the term will appear in a new window named Import List. 4. Select all the genomes of interest and click on + Add. The genomes will now appear on the Selected Genomes menu. You can also select any of your Notebooks and include all the genomes contained in it. 5. Enter your query sequence in FASTA format. If desired, you can change the BLAST Parameters before starting the analysis. 6. Once you have included all this information click on Run CoGe BLAST (Figure 11). 7. The analysis output will include: a table showing the HSP counts for each genome, a graphic depiction of the location of BLAST hits (Genomic HSP Visualization), and a HSP table detailing genetic information for each hit.
|
Sequences with significant similarity to PVX_113230 were found on all the evaluated P. vivax strains, including PO1. However, the number of hits for each P. vivax genome was variable. The highest number of sequence homologs was observed in the strains: Mauritania, PO1, and Salvador-1. This variation further supports previous observations about the high diversity inside the vir family.
The location of sequence hits appears to be slightly variable across genomes. However, we cannot confirm this patterns until the Mauritania, North Korea, Brazil I, and India VII genomes are fully assembled. Between the two fully assembled P. vivax genomes (Salvador-1 and PO1), BLAST hits were located on the same chromosome regions (Figure 12). As expected, a higher number of BLAST hits and a more variable genome location was observed when a less conserved vir family member was used as a query (analysis can be run following this link: https://genomevolution.org/r/mkcg).
Identifying microsyntenic regions (GEvo)
Colinear homologs are used to identify regions of shared common ancestry between two genomes (Synteny). In a small-scale (Microsynteny), changes in local genome organization can be used to ascertain the evolutionary history of a region. In Plasmodium, many events that alter local genome organization are related to genes involved in different aspects of parasite-host interaction. One of the most crucial ones is the multistep process resulting in erythrocyte invasion [33]. Previous studies indicated that the genes involved in this process might present some unique evolutionary patterns. In Laveranian species, the inter-specific genetic distance of orthologs found in an 8 kb segment of chromosome 4 showed a different pattern from that expected of inter-species relations. Two essential erythrocyte invasion genes are found in this region: reticulocyte-binding-like homologous protein 5 (Rh5) and cysteine-rich protective antigen (CyRPA). A further analysis of the region showed that the tree topology of sequences that lie immediately beyond this region was consistent with species-tree topologies. However, the topology build using either Rh5 or CyRPA was not. The unexpected relationships seen on both genes had been explained by a transfer of genetic material between Laveranian ancestors [34].
Here, we will use the CoGe’s tool GEvo to evaluate the genome properties of this region and search for evidence to further support the hypothesized horizontal transfer event.
| The following steps show how to use GEvo to analyze microsyntenic regions:
2. Click on GEvo or follow this link: https://genomevolution.org/coge/GEvo.pl 3. Specify a sequence for each box found under Sequence. You can specify as many as 25 sequences before performing a GEvo analysis. Each box contains: a drop down menu of sequence databases (CoGe database, NCBI GenBank or Direct Submission), the name of the selected sequence (e.g. gene ID numbers), the length of genome segment for display, and additional Sequence Options (skip sequence from the analysis, set sequence as reference, set sequence as reverse complement, or mask the sequence). You can import sequences for analysis by entering their gene IDs on the Name: bar. Alternatively, you can select pairs of genes for analysis from SynMap. 4. Click on Run GEvo. 5. The GEvo analysis will display the syntenic region between the compared genomes. 6. You can modify the parameters of the GEvo analysis on the Algorithm tab. Also, you can modify the information of the graphical display by altering the options on the Results Visualization Options tab.
|
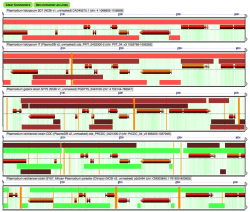
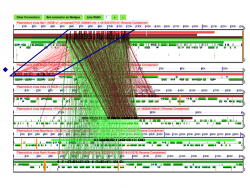
We performed a microsynteny of the genome region containing Rh5 and CyRPA using GEvo. The analysis was conducted using the five fully sequenced Laveranian genomes currently available: P. falciparum strains 3D7 and IT, P. reichenowi strains CDC and SY57, and P. gaboni strain SY75. Our results show that microsynteny is largely maintained in the regions surrounding Rh5 and CyRPA. There does not appear to be marked differences in background GC content in the region either. We modified the Results Visualization Options tab to display wobble GC content for genes in this region. We found no differences in the background or wobble GC content for either Rh5 or CyRPA (Figure 13). It has been proposed that significant changes in background or wobble GC content could be evidence of a horizontal transfer event. However, we did not observed such a pattern in our analyses [35]. However, it is possible that a horizontal transfer event between ancestral Laveranian genomes might not be detected in our analysis due to the similar nucleotide composition of species in the subgenus. Therefore, additional test might be required to further support the proposed horizontal transfer event.
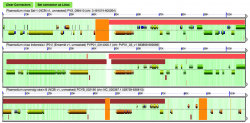
We also used GEvo to further analyze regions where putative inversion breakpoints are located. Comparative analyses between P. vivax (Salvador-1) and P. vivax (PO1), and between P. vivax (Salvador-1) and P. cynomolgi show two inversion events unique to the P. vivax (Salvador-1) genome. No such events are observed in comparisons between P. cynomolgi and the P. vivax (PO1). A detailed study of the inversion breakpoints using GEvo shows genome segments of low sequence quality on P. vivax (Salvador-1) (Figure 14). This opens the possibility that the reported inversion event might be the product of a sequencing artifact instead of a real rearrangement event.
Performing syntenic analyses between two genomes (SynMap)
Over evolutionary time, neighboring genes will maintain their relative genome position and order. This information can be used to infer the location of shared ancestral regions between genomes. Changes in genome organization within these regions are used to ascertain the nature, location and extension of rearrangement events. The main use of CoGE’s tool, SynMap, is finding regions of common ancestry where gene order is preserved and those where is not. Moreover, SynMap’s graphical output allows for easy and fast data interpretation.

| The following steps show how to analyze syntenic gene pairs with SynMap:
2. Click on Organism View or follow this link: https://genomevolution.org/coge/OrganismView.pl 3. Type the scientific name on the Search box and select the appropriate genome. Then, click on the GenomeInfo link under the Genome Information section. 4. Find the link to the SynMap tool under the Analyze section. 5. By default, SynMap will perform a self-comparison of any selected genome. This is of use when characterizing a genome or when attempting to identify the relative age of putative duplication events [36]. You can compare two genomes by changing the genome on display either in Organism 1 or for Organism 2. To do so simply type a scientific name on the Search box and then select a genome. Once you have selected both genomes click on Generate SynMap to run the analysis (Figure 15). 6. SynMap will output a graphical depiction of the syntenic regions between the two genomes. There are currently two version of SynMap: SynMap2, which allows the user to interact with the analysis and dynamically alter the output; and SynMap Legacy, which provides static images of the analysis. 7. You can further analyze regions or genes of interest using the tool GEvo linked to SynMap. To do this, you can double click on a syntenic gene pair (SynMap Legacy), or select a syntenic gene pair and click on Compare in GEvo >>> (SynMap2).
https://genomevolution.org/r/lj12 (P. vivax vs. P. cynomolgi) https://genomevolution.org/r/lj1x (P. knowlesi vs. P. cynomolgi) https://genomevolution.org/r/lj1t (P. knowlesi vs. P vivax)
https://genomevolution.org/r/lq5x (P. knowlesi vs. P. malariae) https://genomevolution.org/r/lj2b (P. coatneyi vs. P. knowlesi) https://genomevolution.org/r/lq5y (P. coatneyi vs. P. malariae) https://genomevolution.org/r/lq5t (P. ovale vs. P. malariae) https://genomevolution.org/r/lq65 (P. coatneyi vs. P. ovale) https://genomevolution.org/r/lq5v (P. ovale vs. P. knowlesi) |
Identifying syntenic gene pairs
We can use SynMap to establish the origin and relative genome location of novel genes, and to determine changes in gene position and order. Gene position can be critical in gene expression. In many eukaryotes, expression of neighboring genes is coordinated by adjacent regulatory elements [37][38][39]. Thus, changes in gene position and order can potentially alter gene expression inside the genomic neighborhood. In P. falciparum, there is evidence that coordinated expression is absent in the highly dynamic subtelomeric regions. Furthermore, subtelomeric neighboring genes are known to form small independently expressed groups in a process thought to increase parasite’s adaptive potential [40]. It is still unknown if the pattern observed in P. falciparum is found outside subtelomeric regions, or even in other Plasmodium parasites. The first step to address this issue is to implement tools that allow the rapid identification of changes in gene order and position. This information can be used to later establish if patterns of coordinated expression, or lack of thereof, are prevalent across the Plasmodium genome and genus.
Identifying chromosomal inversions, fusions, fissions and other events between two genomes
Numerous genome rearrangements have taken place throughout the evolution of the genus Plasmodium. Gene order and organization between species with recent shared ancestry is largely conserved across the genome. This organization however, changes significantly amongst species with longer divergence times [41]. We can use SynMap to infer the putative evolutionary origin and relative location of rearrangement events across the genome.
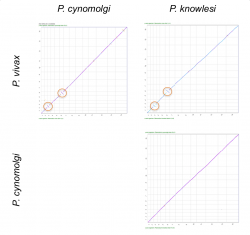
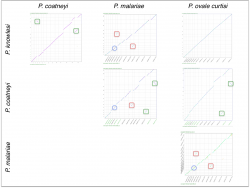
We used SynMap to confirm the relative genome location and time of origin of previously reported rearrangement events. There are two previously reported inversions between P. vivax, P. cynomolgi and P. knowlesi’s 3rd and 6th chromosomes. We used SynMap to evaluate synteny amongst the three species by doing three pairwise comparisons (Figure 16). We did not detect any inversion events between P. cynomolgi and P. knowlesi, but we did in pairwise comparisons with P. vivax (Figure 16, orange circles). This suggest that the inversion events reported on chromosomes 3 and 6 occurred after the split of P. cynomolgi and P. vivax (approximately between 3.43-3.87 Mya) [42]. However, a detailed analysis of the breakpoint regions in P. vivax using GEvo (Figure 14) shows a genome segment of low sequence quality within the region. Thus, it is possible that the inversion event detected on P. vivax could actually be an artifact.
On the other hand we used SynMap to infer any changes in gene order and composition amongst another group of closely related Plasmodium species. Pairwise comparisons were performed between four closely related Plasmodium parasites from the simian clade: P. ovale curtisi, P. malariae, P. coatneyi and P. knowlesi. We identified independent sets of chromosome fusion/fission events across the four Plasmodium species in this group. The first set of fusions/fissions was found on P. malariae’s 5th and 9th chromosome (Figure 17, red squares); the second fusion/fission event was found on P. coatneyi’s 13th and 14th chromosomes (Figure 17, green squares). In addition, we found an inversion event located on the central region of P. malariae’s 4th chromosome (Figure 17, blue circle).
Measuring Kn/Ks values between genomes (SynMap - CodeML analysis tool)
Differences in nucleotide loci will accumulate between two genomes as the result of evolution. The nature of the accumulated changes between homologous coding sequences can be assessed to infer the evolutionary forces at play. Nucleotide changes that do not alter the coded amino acid are called synonymous and those that do so are called non-synonymous. Synonymous substitutions are largely neutral and mostly reflect background evolutionary changes. Alternatively, non-synonymous substitutions are largely affected by natural selection. Under neutrality it is expected that the rate of synonymous (Ks) and non-synonymous (Kn) changes between two sequences will be equivalent. Deviations of this expectation indicate a significant role of natural selection on sequence evolution. Insights into the predominant trends of natural selection are gained from evaluating the direction of change (Kn/Ks ratio). Under neutrality Kn/Ks is expected to equal 1; when non-synonymous substitutions are fixated at a faster rate than synonymous ones we expect Kn/Ks > 1 (positive selection); and, when the rate of fixation of amino acid changes is reduced by the new changes being eliminated we expect Kn/Ks < 1 (purifying selection).
The CoGe platform has the unique capability of calculating the Kn/Ks ratio on syntenic gene pairs across the genome. CoGe’s Kn/Ks analyses can be used to: identify putative associations between natural selection trends and the relative genome position of syntenic gene pairs, find regions evolving at an accelerated or reduced rate compared to overall genome trends, infer the relative age of genome rearrangement events (e.g. duplications), describe genome-specific evolutionary trends, etc. In the genus Plasmodium, variation on of the Kn/Ks ratio can be used to define species- or genus-specific adaptive trends.
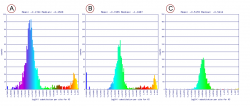
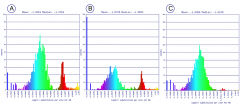
CoGe’s Kn/Ks analyses are performed between two annotated genomes using SynMap. We used SynMap’s CodeML analysis tool to evaluate the evolutionary trends in three closely related Plasmodium species from the Laveranian subgenus (Figure 18).
| The following steps show how to perform Kn/Ks analyses using the CodeML tool available on SynMap:
2. Run SynMap between two genomes. CoGe has the capacity to store all analyses conducted using a users' account, thus, any previously generated SynMap is available for further analysis at a later time. 3. Find the CodeML tool under the Analysis Options tab. Click on the Calculate syntenic CDS pairs and color dots: substitution rates(s) section and select Synonymous (Ks) from the dropdown menu. Repeat the analyses selecting the Non-synonymous (Kn) and (Kn/Ks) options. You can alter the display selecting a different Color Scheme, specifying Min Val. or Max Val. axis values, or changing the Log10 Transform. data option. 4. The analysis will modify the Syntenic_dotplot display to represent the distribution of the Ks, Kn or Kn/Ks values across syntenic gene pairs. In addition, a Histogram of Ks values (or Kn or Ks/Kn) will also be generated. In SynMap2, specific regions can be dynamically selected to view the Ks, Kn or Kn/Ks values.
https://genomevolution.org/r/lsyy (P. reichenowi vs. P. gaboni) https://genomevolution.org/r/lsz2 (P. reichenowi vs. P. falciparum) https://genomevolution.org/r/lsz5 (P. falciparum vs. P. gaboni)
https://genomevolution.org/r/ljhj (P. reichenowi vs. P. falciparum) https://genomevolution.org/r/ljhl (P. falciparum vs. P. gaboni) https://genomevolution.org/r/ljhq (P. reichenowi vs. P. gaboni) |
P. reichenowi and P. falciparum are thought to have diverged approximately 5.28-5.93 Mya [44]. The divergence time of either species with P. gaboni is estimated to be larger [45]. Based on these evolutionary relationships, it would be expected that the number of accumulated differences in nucleotide loci will be smaller between P. reichenowi and P. falciparum, than between either species and P. gaboni. In other words, we expect that accumulated substitutions would be older on comparisons with P. gaboni, than between P. reichenowi and P. falciparum.
Interestingly, our results show different Ks values between P. gaboni (SY57) - P. falciparum (3D7) and P. gaboni (SY57) -P. reichenowi (CDC). We found more recent synonymous substitutions between P. gaboni - P. reichenowi than between P. gaboni - P. falciparum (Figure 19). Additionally, more recent Ks values were observed between P. reichenowi - P. falciparum than between P. falciparum - P. gaboni. The different Ks rates suggest that the P. reichenowi genome has had a recent number of synonymous substitutions after divergence from P. falciparum. Genome composition and codon usage are largely similar amongst Laveranian species (Figures 10 and 24). Therefore, this variation could indicate an increased mutation rate on P. reichenowi, resulting in a more rapidly evolving genome compared to other Laveranian. However, the reasons for this putative increment remain unknown.
On the other hand, non-synonymous (Kn) substitution rates between P. gaboni - P. falciparum and P. gaboni - P. reichenowi were largely similar (Figure 20). As expected, substitutions between P. falciparum - P. reichenowi were both smaller in frequency and more recent in time. These results suggest that a comparable rate of non-synonymous changes has occurred since the divergence of the P. reichenowi/P. falciparum ancestor from P. gaboni. These changes were followed by a significant number of species-specific substitutions on both P. falciparum and P. reichenowi. Previous studies have found large Kn values in P. reichenowi - P. falciparum comparisons; particularly, in genes expressed during critical steps of parasite-host interaction (blood parasite's stages) [46]. Thus, our results suggest that there are a significant number of non-synonymous changes likely related to parasite-host interactions and infection of different host types.
Identifying sets of syntenic genes amongst several genomes (SynFind)
Tools that can efficiently identify homologs genes are valuable on the study of Plasmodium evolution. The study of multigene families hinges on the correct identification of these homologous relations. Small-scale genomic rearrangements are often linked to species-specific gene gain/loss events. Family-linked rearrangements are observed amongst closely related Plasmodium species, and in occasion, at the intra-specific level. CoGe’s tool, SynFind, can be used to study these rearrangement by identifying homologs across any number of genomes.
The evolutionary trajectory of multigene families can be difficult to infer, especially in those with scattered organization or rapid gene turnover. This is particularly truth in species-specific families; however, multigene families shared across the Plasmodium genus can also have some intricate evolutionary patterns. In particular, the evolutionary history of the SERA (serine repeat antigen) family is highly dynamic. This family has experienced a significant number of inter-specific contractions, expansions, and rearrangements. However, these patterns remain to be evaluated at an intra-specific level. We will use SynFind to study the evolutionary patterns of the SERA multigene family in 6 P. vivax strains.
SERA paralogs are expressed during various stages of the Plasmodium life cycle. All SERA family members code proteins with a papain-like cysteine protease motif [47]. These motifs are commonly found both inside and outside the genus Plasmodium [48][49]. One member (SERA-5), expressed during late trophozoite and schizont stages, has been considered as a promising malaria vaccine target [50]. We will use this gene sequence as a query for the SynFind analysis.
| The following steps show how to use SynFind:
2. Click on SynFind or follow this link: https://genomevolution.org/CoGe/SynFind.pl. 3. Type a scientific name of your search bar under Select Target Genomes. Organisms and genomes with names matching the search term will be displayed on the Matching Organisms menu. 4. Select the genomes of interest using Crtl+click or Command+click, then click on + Add. The genomes will appear on the Selected Genomes menu. You can also import genomes from any Notebook. 5. Type the Name, Annotation or Organisms on the Specify Features section. It is recommended to provide as many specifics for this query as possible; nonetheless, the analysis can be performed without using explicit terms. Once you are done click on Search. 6. All matches to the search term, and the genome where they have been found, will appear in new menu within the same section. Select all relevant Matches and the reference Genome. 7. Click on Run SynFind to start the analysis. 8. SynFind will output all syntenic regions found on the reference genome and their Syntenic depth. This output can be used to inform other CoGe’s tools and continue the analysis.
GEvo results can be replicated here: https://genomevolution.org/r/mozl |
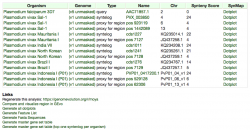
We used Synfind to identify genes homologous to SERA-5 across 6 P. vivax genomes (Figure 21). We informed a GEvo analysis of the region with the output from Synfind. Our results show a conserved number of SERA paralogs in all P. vivax strains. Interestingly, the organization of the SERA family was different on the Brazil I strain respect to other P. vivax strains (Figure 22). Previous studies on SERA have suggested that some family members are unique to the genomes of P. vivax and closely related species [51]. Our results suggest that family organization is not completely conserved on the intra-specific level. This appears to be specially truth of recently duplicated paralogs. On the other hand, SynFind identified matching segments outside the SERA multigene family. These segments belonged to hypothetical protein coding genes, ATP proteases, and uncharacterized transcripts. As previously mentioned, the papain-like cysteine protease motif is commonly found both outside the SERA family and the genus Plasmodium. Thus, is likely that these segments share the papain-like cysteine protease motif but are not evolutionarily related to SERA.
Identifying codon and amino acid substitution frequencies (CodeOn)

Codon and amino acid usage are significantly affected by extreme changes in compositional bias. Despite P. falciparum’s AT rich genome, many highly expressed genes are known to be majorly composed of C-ended codons. This pattern could suggest a certain level of translational selection. It has been proposed that usage of less energetically expensive amino acids provides an evolutionary advantage by decreasing energetic costs during infection [52]. On the other hand, codon usage bias has been shown to have a small role on translational selection on the GC rich P. vivax genome [53]. These results suggest that compositional bias might have a variable effect on translational selection across Plasmodium species.
We can measure the effects of composition bias on amino acid usage across the genus Plasmodium using the currently available genomes. We will use CoGe’s tool CodeOn to calculated amino acid usage across genomes with different %GC levels, and to determine the number of CDS on different %GC tiers. The role of compositional bias will be assessed in 7 fully sequenced Plasmodium genomes belonging to two of the mayor four Plasmodium clades (Laveranian and simian).

| The following steps indicate how to built amino acid usage tables using CodeOn:
2. Find the genome of interest in OrganismView or follow this link https://genomevolution.org/coge/OrganismView.pl 3. Click on CodeOn to start the analysis. After a couple of minutes, the output will be shown in a different tab.
https://genomevolution.org/coge/CodeOn.pl?oid=27002 (P. vivax) https://genomevolution.org/coge/CodeOn.pl?dsgid=32770 (P. cynomolgi) https://genomevolution.org/coge/CodeOn.pl?oid=26997 (P. knowlesi) https://genomevolution.org/coge/CodeOn.pl?oid=40698 (P. coatneyi)
https://genomevolution.org/coge/CodeOn.pl?oid=26992 (P. falciparum) https://genomevolution.org/coge/CodeOn.pl?oid=40801 (P. reichenowi) https://genomevolution.org/coge/CodeOn.pl?oid=40696 (P. gaboni) |
Closely related Plasmodium species showed similar amino acid usage patterns (Figure 23 and Figure 24). On the other hand, amino acid usage trends were markedly different in species from different clades. P. vivax (Salvador-1) had the highest number of CDS with 45-55% GC content. Closely related species (P. cynomolgi, P. knowlesi, and P.coatneyi) had a higher number of CDS in the 40-45% GC tier (Figure 23). Alternatively, the number of CDS with 20-30% GC content was significantly larger on Plasmodium species of the Laveranian subgenus. Genome composition is similar between P. cynomolgi, P. knowlesi, and P. coatneyi (Figure 9 and Figure 10). However, patterns of amino acid usage were markedly different on P. coatneyi respect to other simian species. In the Laveranian subgenus, P. falciparum (3D7) and P. reichenowi (SY57) showed similar amino acid usage bias (Figure 24), while P. gaboni showed a slightly different pattern of codon usage. The variation seen in P. gaboni is noteworthy given that the three species share a similar compositional bias (Figure 9 and Figure 10). This result suggests that compositional genome bias might be just one factor influencing amino acid usage bias in the simian clade and Laveranian subgenus.
Using Syntenic Path Assembly (SPA) to make analysis of poor or early genome assemblies easier (SynMap - SPA tool)
There are a large number of Plasmodium genomes that remain to be fully sequenced, assembled and annotated. Incomplete genomic data comes from a variety of sources: genomic information published on early assembly stages, partially sequenced genomes, low quality genome segments, etc. The successful sequencing of Plasmodium genomes is a difficult task. However, sequencing projects can be slightly simplified by the use of a reference genome as a guideline for genome assembly. While unassembled and non-annotated genomes can be used in smaller scale studies (e.g. orthologs can be identified with BLAST), there are limitations in their usability in large-scale comparative genomics.
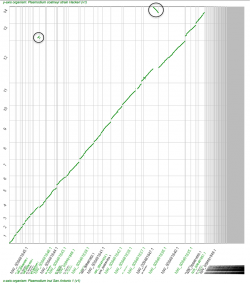
Tools that generate preliminary assemblies have great significance in comparative analyses, especially when large amounts of genomic data become available. CoGe’s tool, Syntenic_path_assembly (SPA), creates a graphical display of syntenic gene pairs using any reference genome. This tool can be used to generate quick genome assemblies. We will use SPA to assemble the P. inui genome (on scaffold level as in 2016) using the fully assembled P. coatneyi genome as a reference.
| The following steps show how to use SynMap - SPA tool:
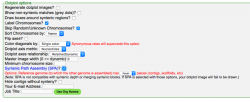
2. Run SynMap between an assembled and a non-assembled genome (this might take longer than analyses using fully assembled genomes). 3. After running SynMap click on the Display Options tab and find the SPA tool (Figure 25). Select the tool by clicking on the check mark next to: The Syntenic Path Assembly (SPA)? 4. After a few minutes the incomplete genome will be assembled using the second genome as a reference.
|
While SPA is extremely useful for whole genome analyses, there are some limitations regarding assembly interpretation. We highlight two scenarios seen on the P. inui SPA assembly performed using the P. coatneyi genome as reference (Figure 26):
First, contigs will be arranged to increase synteny between the incomplete genome and the reference genome. Thus, using different reference genomes will result in different preliminary assemblies. In the case of P. inui, using P. coatneyi (a closely related species) or P. falciparum (a distant species) as reference will result on different assemblies. Therefore, before running SPA, the reference genomes should be selected after careful consideration of the biological and evolutionary relation between species. Second, rearrangement events such as inversions or duplications cannot be identified using SPA. For one, several contigs can be syntenic to the same region on the reference genome without signaling a duplication event. Also, contigs syntenic to a reverse DNA strand might not reflect chromosome inversions.
Overall conclusions
The number of available Plasmodium genomes has increased markedly during recent years. The increment of genomic information creates an unprecedented opportunity to study the unique genomic qualities of Plasmodium.
Thanks to worldwide efforts, there has been a significant reduction in the number of malaria cases and malaria related deaths between 2000 and 2015. By 2015, it was estimated that the number of malaria cases decreased from 262 millions to 214 millions, and the number of malaria related deaths from 839,000 to 438,000 [54]. While this indicates an enormous achievement in malaria treatment and control strategies, there are still numerous aspects that need to be further addressed in malaria research.
The intricacies of parasite-host relations in Plasmodium infection might be more complex than previously considered [55]. There have been cases of humans being infected by non-human primates Plasmodium parasites (a woman infected with P. cynomolgi on South East Asia) [56] and P. knowlesi [57]. Alternatively, there have also been reported infections of African primates by P. falciparum strains (a parasite classically considered unique to humans) [58][59]. In bird Plasmodium species, the duration of parasite-host associations have a significant role in the development of pathogenicity and in host mortality [60].
Insight onto Plasmodium’s genome organization and the evolutionary forces shaping these relationships are gained from molecular and comparative analyses. Moreover, the rapid wroth of genomic information makes implementing tools that facilitate assessing genome evolutionary trends an imperative task. The services and tools provided by the CoGe platform: genome import and export, analysis, and visualization are of considerable use in advancing Plasmodium comparative genomics. Here, we showed how various CoGe tools could be used to assess evolutionary patterns unique to Plasmodium genomes. We also showed how to use this platform to further characterize sequenced Plasmodium genomes on different levels of completion. Overall, we have shown that evolutionary questions such as: the origins of Laveranian AT rich genomes, genome rearrangements between mammal Plasmodium, the origin of genes involved in host-specificity and virulence, and multigene families’ evolutionary patterns, can be answered using CoGe’s tools.
Useful links
Plasmodium Notebooks in CoGe
- Link to Notebook for published Plasmodium genome data: https://genomevolution.org/coge/NotebookView.pl?lid=1753
- Link to Notebook for published P. falciparum strains: https://genomevolution.org/coge/NotebookView.pl?lid=1758
- Link to Notebook for published P. vivax strains: https://genomevolution.org/coge/NotebookView.pl?lid=1760
- Link to Notebook for published Plasmodium apicoplast data: https://genomevolution.org/coge/NotebookView.pl?lid=1754
- Link to Notebook for published Plasmodium mitochondrion data: https://genomevolution.org/coge/NotebookView.pl?lid=1756
Sample data
- Gene sequence used on CoGeBLAST analysis (obtained from PlasmoDB):
- PVX_113230.1 | Plasmodium vivax Sal-1 | variable surface protein Vir14-related (http://plasmodb.org/plasmo/app/record/gene/PVX_113230)
- PVX_096004.1 | Plasmodium vivax Sal-1 | VIR protein (http://plasmodb.org/plasmo/app/record/gene/PVX_096004)
- PVX_003830.1 | Plasmodium vivax Sal-1 | serine-repeat antigen 5 (SERA) (http://plasmodb.org/plasmo/app/record/gene/PVX_003830)
- Gene sequences used on CoGeBLAST used to inform GEvo analysis (obtained from PlasmoDB):
- PF3D7_0424100.1 | Plasmodium falciparum 3D7 | reticulocyte binding protein homologue 5 (http://plasmodb.org/plasmo/app/record/gene/PF3D7_0424100)
- PVX_096410.1 | Plasmodium vivax Sal-1 | cysteine repeat modular protein 2, putative (http://plasmodb.org/plasmo/app/record/gene/PVX_096410)
References
- ↑ Jackson AP. 2015. Preface. The evolution of parasite genomes and the origins of parasitism. Parasitology. 142 Suppl 1:S1-5. https://www.ncbi.nlm.nih.gov/pubmed/25656359
- ↑ Carlton JM, Perkins SL, Deitsch KW. 2013. Malaria Parasites. Caister Academic Press
- ↑ Tachibana SI, Sullivan SA, Kawai S, Nakamura S, Kim HR, Goto N, Arisue N, Palacpac NM, Honma H, Yagi M, Tougan T, Katakai Y, Kaneko O, Mita T, Kita K, Yasutomi Y, Sutton PL, Shakhbatyan R, Horii T, Yasunaga T, Barnwell JB, Escalante AA, Carlton JM, Tanabe K. 2012. Plasmodium cynomolgi genome sequences provide insight into Plasmodium vivax and the monkey malaria clade. Nat Genet. 44: 1051–1055. https://www.ncbi.nlm.nih.gov/pmc/articles/PMC3759362/
- ↑ Prugnolle F, Durand P, Ollomo B, Duval L, Ariey F, Arnathau C, Gonzalez JP, Leroy E, Renaud F. 2011. A Fresh Look at the Origin of Plasmodium falciparum, the Most Malignant Malaria Agent. PLoS Pathog. 7: e1001283. http://journals.plos.org/plospathogens/article?id=10.1371/journal.ppat.1001283
- ↑ Prugnolle F, Rougeron V, Becquart P, Berry A, Makanga B, Rahola N, Arnathau C, Ngoubangoye B, Menard S, Willaume E, Ayala FJ, Fontenille D, Ollomo B, Durand P, Paupy C, Renaud F. 2013. Diversity, host switching and evolution of Plasmodium vivax infecting African great apes. Proc Natl Acad Sci U S A. 110:8123-8. https://www.ncbi.nlm.nih.gov/pubmed/23637341
- ↑ DeBarry JD, Kissinger JC. 2011. Jumbled Genomes: Missing Apicomplexan Synteny. Mol Biol Evol. 2011 Oct; 28(10): 2855–2871. https://www.ncbi.nlm.nih.gov/pmc/articles/PMC3176833/
- ↑ Sinka ME, Bangs MJ, Manguin S, Rubio-Palis Y, Chareonviriyaphap T, Coetzee M, Mbogo CM, Hemingway J, Patil AP, Temperley WH, Gething PW, Kabaria CW, Burkot TR, Harbach RE, Hay SI. 2012. A global map of dominant malaria vectors. Parasit Vectors. 5:69. https://www.ncbi.nlm.nih.gov/pubmed/22475528
- ↑ Buscaglia CA, Kissinger JC, Agüero F. 2015. Neglected Tropical Diseases in the Post-Genomic Era. Trends Genet. 31:539-55. https://www.ncbi.nlm.nih.gov/pubmed/26450337
- ↑ Clark K, Karsch-Mizrachi I, Lipman DJ, Ostell J, Sayers EW. 2016. GenBank. Nucleic Acids Res. 44: D67–D72. https://www.ncbi.nlm.nih.gov/pmc/articles/PMC4702903/
- ↑ Aurrecoechea C, Brestelli J, Brunk BP, Dommer J, Fischer S, Gajria B, Gao X, Gingle A, Grant G, Harb OS, Heiges M, Innamorato F, Iodice J, Kissinger JC, Kraemer E, Li W, Miller JA, Nayak V, Pennington C, Pinney DF, Roos DS, Ross C, Stoeckert CJ Jr, Treatman C, Wang H. 2009. PlasmoDB: a functional genomic database for malaria parasites. Nucleic Acids Res. 37:D539-43. https://www.ncbi.nlm.nih.gov/pubmed/18957442
- ↑ Logan-Klumpler FJ, De Silva N, Boehme U, Rogers MB, Velarde G, McQuillan JA, Carver T, Aslett M, Olsen C, Subramanian S, Phan I, Farris C, Mitra S, Ramasamy G, Wang H, Tivey A, Jackson A, Houston R, Parkhill J, Holden M, Harb OS, Brunk BP, Myler PJ, Roos D, Carrington M, Smith DF, Hertz-Fowler C, Berriman M. 2012. GeneDB--an annotation database for pathogens. Nucleic Acids Res. 40:D98-108. https://www.ncbi.nlm.nih.gov/pubmed/22116062
- ↑ Bensch S, Hellgren O, Pérez-Tris J. 2009. MalAvi: a public database of malaria parasites and related haemosporidians in avian hosts based on mitochondrial cytochrome b lineages. Mol Ecol Resour. 9:1353-8. https://www.ncbi.nlm.nih.gov/pubmed/21564906
- ↑ Gardner MJ, Hall N, Fung E, White O, Berriman M, Hyman RW, Carlton JM, Pain A, Nelson KE, Bowman S, Paulsen IT, James K, Eisen JA, Rutherford K, Salzberg SL, Craig A, Kyes S, Chan MS, Nene V, Shallom SJ, Suh B, Peterson J, Angiuoli S, Pertea M, Allen J, Selengut J, Haft D, Mather MW, Vaidya AB, Martin DM, Fairlamb AH, Fraunholz MJ, Roos DS, Ralph SA, McFadden GI, Cummings LM, Subramanian GM, Mungall C, Venter JC, Carucci DJ, Hoffman SL, Newbold C, Davis RW, Fraser CM, Barrell B. 2002. Genome sequence of the human malaria parasite Plasmodium falciparum. Nature. 419:498-511
- ↑ Wu H, Zhang Z, Hu S, Yucorresponding S. 2012. On the molecular mechanism of GC content variation among eubacterial genomes. Biol Direct. 2012; 7: 2. https://www.ncbi.nlm.nih.gov/pmc/articles/PMC3274465/
- ↑ Lassalle F, Périan S, Bataillon T, Nesme X, Duret L, Daubin V. 2015. GC-Content Evolution in Bacterial Genomes: The Biased Gene Conversion Hypothesis Expands. PLoS Genet. 11: e1004941. https://www.ncbi.nlm.nih.gov/pmc/articles/PMC4450053/
- ↑ Šmarda P, Bureš P, Horová L, Leitch IJ, Mucina L, Pacini E, Tichý L, Grulich V, Rotreklováa O. 2014. Ecological and evolutionary significance of genomic GC content diversity in monocots. Proc Natl Acad Sci U S A. 111: E4096–E4102. https://www.ncbi.nlm.nih.gov/pmc/articles/PMC4191780/
- ↑ Gardner MJ, Hall N, Fung E, White O, Berriman M, Hyman RW, Carlton JM, Pain A, Nelson KE, Bowman S, Paulsen IT, James K, Eisen JA, Rutherford K, Salzberg SL, Craig A, Kyes S, Chan MS, Nene V, Shallom SJ, Suh B, Peterson J, Angiuoli S, Pertea M, Allen J, Selengut J, Haft D, Mather MW, Vaidya AB, Martin DM, Fairlamb AH, Fraunholz MJ, Roos DS, Ralph SA, McFadden GI, Cummings LM, Subramanian GM, Mungall C, Venter JC, Carucci DJ, Hoffman SL, Newbold C, Davis RW, Fraser CM, Barrell B. 2002. Genome sequence of the human malaria parasite Plasmodium falciparum. Nature. 419:498-511
- ↑ Jackson AP. 2015. Preface. The evolution of parasite genomes and the origins of parasitism. Parasitology. 142 Suppl 1:S1-5. https://www.ncbi.nlm.nih.gov/pubmed/25656359
- ↑ DeBarry JD, Kissinger JC. 2011. Jumbled Genomes: Missing Apicomplexan Synteny. Mol Biol Evol. 2011 Oct; 28(10): 2855–2871. https://www.ncbi.nlm.nih.gov/pmc/articles/PMC3176833/
- ↑ Gardner MJ, Hall N, Fung E, White O, Berriman M, Hyman RW, Carlton JM, Pain A, Nelson KE, Bowman S, Paulsen IT, James K, Eisen JA, Rutherford K, Salzberg SL, Craig A, Kyes S, Chan MS, Nene V, Shallom SJ, Suh B, Peterson J, Angiuoli S, Pertea M, Allen J, Selengut J, Haft D, Mather MW, Vaidya AB, Martin DM, Fairlamb AH, Fraunholz MJ, Roos DS, Ralph SA, McFadden GI, Cummings LM, Subramanian GM, Mungall C, Venter JC, Carucci DJ, Hoffman SL, Newbold C, Davis RW, Fraser CM, Barrell B. 2002. Genome sequence of the human malaria parasite Plasmodium falciparum. Nature. 419:498-511
- ↑ Carlton JM, Adams JH, Silva JC, Bidwell SL, Lorenzi H, Caler E, Crabtree J, Angiuoli SV, Merino EF, Amedeo P, Cheng Q, Coulson RM, Crabb BS, Del Portillo HA, Essien K, Feldblyum TV, Fernandez-Becerra C, Gilson PR, Gueye AH, Guo X, Kang'a S, Kooij TW, Korsinczky M, Meyer EV, Nene V, Paulsen I, White O, Ralph SA, Ren Q, Sargeant TJ, Salzberg SL, Stoeckert CJ, Sullivan SA, Yamamoto MM, Hoffman SL, Wortman JR, Gardner MJ, Galinski MR, Barnwell JW, Fraser-Liggett CM. 2008. Comparative genomics of the neglected human malaria parasite Plasmodium vivax. Nature. 455:757-63. https://www.ncbi.nlm.nih.gov/pubmed/18843361
- ↑ Nikbakht H, Xia X, Hickey DA. 2014. The evolution of genomic GC content undergoes a rapid reversal within the genus Plasmodium. Genome. 9:507-511. https://www.ncbi.nlm.nih.gov/pubmed/25633864
- ↑ Hayakawa T, Culleton R, Otani H, Horii T, Tanabe K. 2008. Big bang in the evolution of extant malaria parasites. Mol Biol Evol. 10:2233-9. https://www.ncbi.nlm.nih.gov/pubmed/18687771
- ↑ Bensch S, Canbäck B, DeBarry JD, Johansson T, Hellgren O, Kissinger JC, Palinauskas V, Videvall E, Valkiūnas G. 2016. The Genome of Haemoproteus tartakovskyi and Its Relationship to Human Malaria Parasites. Genome Biol Evol. 8:1361-73.https://www.ncbi.nlm.nih.gov/pubmed/27190205
- ↑ Niang M, Yan Yam X, Preiser PR. 2009. The Plasmodium falciparum STEVOR multigene family mediates antigenic variation of the infected erythrocyte. PLoS Pathog. 5:e1000307. https://www.ncbi.nlm.nih.gov/pubmed/19229319
- ↑ Witmer K, Schmid CD, Brancucci NM, Luah YH, Preiser PR, Bozdech Z, Voss TS. 2012. Analysis of subtelomeric virulence gene families in Plasmodium falciparum by comparative transcriptional profiling. Mol Microbiol. 84:243-59. https://www.ncbi.nlm.nih.gov/pmc/articles/PMC3491689/
- ↑ Petter M, Bonow I, Klinkert MQ. 2008. Diverse expression patterns of subgroups of the rif multigene family during Plasmodium falciparum gametocytogenesis. PLoS One. 3:e3779. http://journals.plos.org/plosone/article?id=10.1371/journal.pone.0003779
- ↑ Singh V, Gupta P, Pande V. 2014. Revisiting the multigene families: Plasmodium var and vir genes. J Vector Borne Dis. 51:75-81. https://www.ncbi.nlm.nih.gov/pubmed/24947212
- ↑ Carlton JM, Adams JH, Silva JC, Bidwell SL, Lorenzi H, Caler E, Crabtree J, Angiuoli SV, Merino EF, Amedeo P, Cheng Q, Coulson RM, Crabb BS, Del Portillo HA, Essien K, Feldblyum TV, Fernandez-Becerra C, Gilson PR, Gueye AH, Guo X, Kang'a S, Kooij TW, Korsinczky M, Meyer EV, Nene V, Paulsen I, White O, Ralph SA, Ren Q, Sargeant TJ, Salzberg SL, Stoeckert CJ, Sullivan SA, Yamamoto MM, Hoffman SL, Wortman JR, Gardner MJ, Galinski MR, Barnwell JW, Fraser-Liggett CM. 2008. Comparative genomics of the neglected human malaria parasite Plasmodium vivax. Nature. 455:757-63. https://www.ncbi.nlm.nih.gov/pubmed/18843361
- ↑ Lopez FJ, Bernabeu M, Fernandez-Becerra C, del Portillo HA. 2013. A new computational approach redefines the subtelomeric vir superfamily of Plasmodium vivax. BMC Genomics. 14:8. https://www.ncbi.nlm.nih.gov/pubmed/?term=A+new+computational+approach+redefines+the+subtelomeric+vir+superfamily+of+Plasmodium+vivax
- ↑ Fernandez-Becerra C, Yamamoto MM, Vêncio RZ, Lacerda M, Rosanas-Urgell A, del Portillo HA. 2009. Plasmodium vivax and the importance of the subtelomeric multigene vir superfamily. Trends Parasitol. 2009 25:44-51. https://www.ncbi.nlm.nih.gov/pubmed/19036639
- ↑ Neafsey DE, Galinsky K, Jiang RH, Young L, Sykes SM, Saif S, Gujja S, Goldberg JM, Young S, Zeng Q, Chapman SB, Dash AP, Anvikar AR, Sutton PL, Birren BW, Escalante AA, Barnwell JW, Carlton JM. 2012. The malaria parasite Plasmodium vivax exhibits greater genetic diversity than Plasmodium falciparum. Nat Genet. 44:1046-50. https://www.ncbi.nlm.nih.gov/pubmed/22863733
- ↑ Cowman AF, Crabb BS. 2006. Invasion of red blood cells by malaria parasites. Cell. 124:755-66. https://www.ncbi.nlm.nih.gov/pubmed/16497586
- ↑ Sundararaman SA, Plenderleith LJ, Liu W, Loy DE, Learn GH, Li Y, Shaw KS, Ayouba A, Peeters M, Speede S, Shaw GM, Bushman FD, Brisson D, Rayner JC, Sharp PM, Hahn BH. 2016. Genomes of cryptic chimpanzee Plasmodium species reveal key evolutionary events leading to human malaria. Nat Commun. 7:11078. https://www.ncbi.nlm.nih.gov/pubmed/27002652
- ↑ Sundararaman SA, Plenderleith LJ, Liu W, Loy DE, Learn GH, Li Y, Shaw KS, Ayouba A, Peeters M, Speede S, Shaw GM, Bushman FD, Brisson D, Rayner JC, Sharp PM, Hahn BH. 2016. Genomes of cryptic chimpanzee Plasmodium species reveal key evolutionary events leading to human malaria. Nat Commun. 7:11078. https://www.ncbi.nlm.nih.gov/pubmed/27002652
- ↑ Tang H, Lyons E. 2012. Unleashing the Genome of Brassica Rapa. Front Plant Sci. 3: 172. https://www.ncbi.nlm.nih.gov/pmc/articles/PMC3408644/
- ↑ Ghanbarian AT, Hurst LD. 2015. Neighboring Genes Show Correlated Evolution in Gene Expression. Mol Biol Evol. doi:10.1093/molbev/msv053http://mbe.oxfordjournals.org/content/early/2015/04/01/molbev.msv053.full
- ↑ De S, Teichmann SA, Babu MM. 2009. The impact of genomic neighborhood on the evolution of human and chimpanzee transcriptome. Genome Res. 19(5): 785–794. https://www.ncbi.nlm.nih.gov/pmc/articles/PMC2675967/
- ↑ Michalak P. 2008. Coexpression, coregulation, and cofunctionality of neighboring genes in eukaryotic genomes. Genomics. 91:(43–248) http://www.sciencedirect.com/science/article/pii/S0888754307002807
- ↑ Rovira-Graells N, Gupta AP, Planet E, Crowley VM, Mok S, Ribas de Pouplana L, Preiser PR, Bozdech Z, Cortés A. 2012. Transcriptional variation in the malaria parasite Plasmodium falciparum. Genome Res. 5:925-38. https://www.ncbi.nlm.nih.gov/pubmed/22415456
- ↑ Tachibana SI, Sullivan SA, Kawai S, Nakamura S, Kim HR, Goto N, Arisue N, Palacpac NM, Honma H, Yagi M, Tougan T, Katakai Y, Kaneko O, Mita T, Kita K, Yasutomi Y, Sutton PL, Shakhbatyan R, Horii T, Yasunaga T, Barnwell JB, Escalante AA, Carlton JM, Tanabe K. 2012. Plasmodium cynomolgi genome sequences provide insight into Plasmodium vivax and the monkey malaria clade. Nat Genet. 44: 1051–1055. https://www.ncbi.nlm.nih.gov/pmc/articles/PMC3759362/
- ↑ Pacheco MA, Reid MJ, Schillaci MA, Lowenberger CA, Galdikas BM, Jones-Engel L, Escalante AA. 2012. The origin of malarial parasites in orangutans. PLoS One. 7:e34990. https://www.ncbi.nlm.nih.gov/pubmed/22536346
- ↑ Rayner JC, Liu W, Peeters M, Sharp PM, Hahn BH. 2011. A plethora of Plasmodium species in wild apes: a source of human infection? Trends Parasitol. 27:222-9. https://www.ncbi.nlm.nih.gov/pubmed/21354860?dopt=Abstract&holding=npg
- ↑ Pacheco MA, Reid MJ, Schillaci MA, Lowenberger CA, Galdikas BM, Jones-Engel L, Escalante AA. 2012. The origin of malarial parasites in orangutans. PLoS One. 7:e34990. https://www.ncbi.nlm.nih.gov/pubmed/22536346
- ↑ Sundararaman SA, Plenderleith LJ, Liu W, Loy DE, Learn GH, Li Y, Shaw KS, Ayouba A, Peeters M, Speede S5, Shaw GM, Bushman FD, Brisson D, Rayner JC, Sharp PM, Hahn BH. 2016. Genomes of cryptic chimpanzee Plasmodium species reveal key evolutionary events leading to human malaria. Nat Commun. 7:11078. https://www.ncbi.nlm.nih.gov/pubmed/27002652
- ↑ Otto TD, Rayner JC, Böhme U, Pain A, Spottiswoode N, Sanders M, Quail M, Ollomo B, Renaud F, Thomas AW, Prugnolle F, Conway DJ, Newbold C, Berriman M. 2014. Genome sequencing of chimpanzee malaria parasites reveals possible pathways of adaptation to human hosts. Nat Commun. 5:4754. https://www.ncbi.nlm.nih.gov/pubmed/25203297
- ↑ Arisue N, Kawai S, Hirai M, Palacpac NM, Jia M, Kaneko A, Tanabe K, Horii T. 2011. Clues to Evolution of the SERA Multigene Family in 18 Plasmodium Species. PLoS One. 6: e17775. http://journals.plos.org/plosone/article?id=10.1371/journal.pone.0017775
- ↑ Prasad R, Atul, Soni A, Puri SK, Sijwali PS. 2012. Expression, characterization, and cellular localization of knowpains, papain-like cysteine proteases of the Plasmodium knowlesi malaria parasite. PLoS One. 12:e51619. https://www.ncbi.nlm.nih.gov/pubmed/23251596
- ↑ Brömme D. 2001. Papain-like cysteine proteases. Curr Protoc Protein Sci. 21. doi: 10.1002/0471140864.ps2102s21. https://www.ncbi.nlm.nih.gov/pubmed/18429163
- ↑ Arisue N, Hirai M, Arai M, Matsuoka H, Horii T. 2007. Phylogeny and evolution of the SERA multigene family in the genus Plasmodium. J Mol Evol. 65:82-91. http://link.springer.com/article/10.1007%2Fs00239-006-0253-1
- ↑ Arisue N, Kawai S, Hirai M, Palacpac NM, Jia M, Kaneko A, Tanabe K, Horii T. 2011. Clues to Evolution of the SERA Multigene Family in 18 Plasmodium Species. PLoS One. 6: e17775. http://journals.plos.org/plosone/article?id=10.1371/journal.pone.0017775
- ↑ Peixoto L, Fernández V, Musto H. 2004. The effect of expression levels on codon usage in Plasmodium falciparum. Parasitology. 128:245-51. https://www.ncbi.nlm.nih.gov/pubmed/15074874
- ↑ Yadav MK, Swati D. 2012. Comparative genome analysis of six malarial parasites using codon usage bias based tools. Bioinformation. 8:1230-9. https://www.ncbi.nlm.nih.gov/pubmed/23275725
- ↑ World Health Organization. (2015). World Malaria Report 2015. Retrieved from http://www.who.int/malaria/publications/world-malaria-report-2015/report/en/
- ↑ Garamszegi LZ. 2009. Patterns of co-speciation and host switching in primate malaria parasites. Malar J. 110. doi: 10.1186/1475-2875-8-110. https://www.ncbi.nlm.nih.gov/pubmed/19463162
- ↑ Ta TH, Hisam S, Lanza M, Jiram AI, Ismail N, Rubio JM. 2014. First case of a naturally acquired human infection with Plasmodium cynomolgi. Malar J. 13: 68. https://www.ncbi.nlm.nih.gov/pmc/articles/PMC3937822/
- ↑ Singh B, Daneshvar C. 2013. Human infections and detection of Plasmodium knowlesi. Clin Microbiol Rev. 26:165-84. https://www.ncbi.nlm.nih.gov/pubmed/23554413
- ↑ Prugnolle F, Durand P, Neel C, Ollomo B, Ayala FJ, Arnathau C, Etienne L, Mpoudi-Ngole E, Nkoghe D, Leroy E, Delaporte E, Peeters M, Renaud F. 2010. African great apes are natural hosts of multiple related malaria species, including Plasmodium falciparum. Proc Natl Acad Sci U S A. 107:1458-63. https://www.ncbi.nlm.nih.gov/pubmed/20133889
- ↑ Duval L, Fourment M, Nerrienet E, Rousset D, Sadeuh SA, Goodman SM, Andriaholinirina NV, Randrianarivelojosia M, Paul RE, Robert V, Ayala FJ, Ariey F. 2010. African apes as reservoirs of Plasmodium falciparum and the origin and diversification of the Laverania subgenus. Proc Natl Acad Sci U S A. 107:10561-6. https://www.ncbi.nlm.nih.gov/pubmed/20498054
- ↑ Krizanauskiene A, Hellgren O, Kosarev V, Sokolov L, Bensch S, Valkiunas G. 2006. Variation in host specificity between species of avian hemosporidian parasites: evidence from parasite morphology and cytochrome B gene sequences. J Parasitol. 6:1319-24. https://www.ncbi.nlm.nih.gov/pubmed/17304814