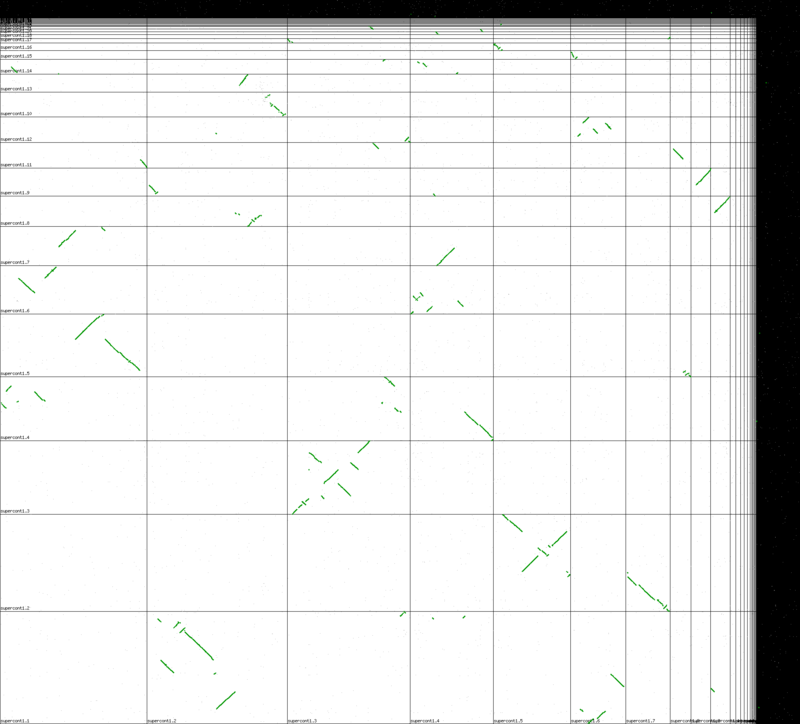
Magnaporthe poae ATCC 64411 versus Gaeumannomyces graminis var. tritici
From CoGepedia
Syntenic dotplot between:
- Magnaporthe poae ATCC 64411 (http://genomevolution.org/CoGe/OrganismView.pl?oid=31666)
- Gaeumannomyces graminis var. tritici (http://genomevolution.org/CoGe/OrganismView.pl?oid=31667)

Syntenic dotplot between Magnaporthe poae ATCC 64411 (y-axis) versus Gaeumannomyces graminis var. tritici (x-axis). Results can be regenerated at: http://genomevolution.org/CoGe/SynMap.pl?dsgid1=9197;dsgid2=9195;c=4;D=20;g=10;A=5;Dm=0;gm=0;w=0;b=1;ft1=1;ft2=1;do1=1;do2=1;do=40;dt=geneorder

GEvo high-resolution sequence analysis of syntenic regions between Gaeumannomyces graminis var. tritici (top panel) and Magnaporthe poae ATCC 64411 (bottom panel). Orange regions in the background of each panel are unsequenced regions; pink blocks and wedges are regions with sequence similarity. Note the inversion in the middle of these regions. Results can be regenerated at: http://genomevolution.org/r/6yu