Brassica oleracea v. Arabidopsis thaliana
From CoGepedia

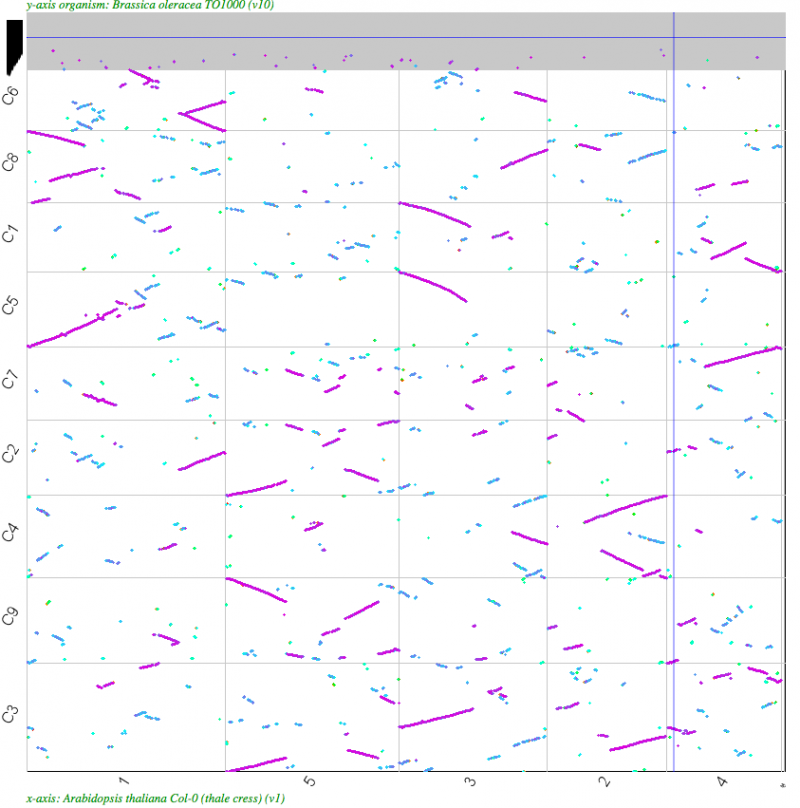
SynMap syntenic dotplot of A. thaliana (x-axis) v. B. oleracea (y-axis). Syntenic gene pairs colored by synonymous mutation values. Pink regions are younger than blue regions and represent orthologous and out-paralogs regions respecitvely. Note the 1:3 syntenic depth between orthologous A. thaliana and B. oleracea. Results may be regenerated at: http://genomevolution.org/r/4qe9

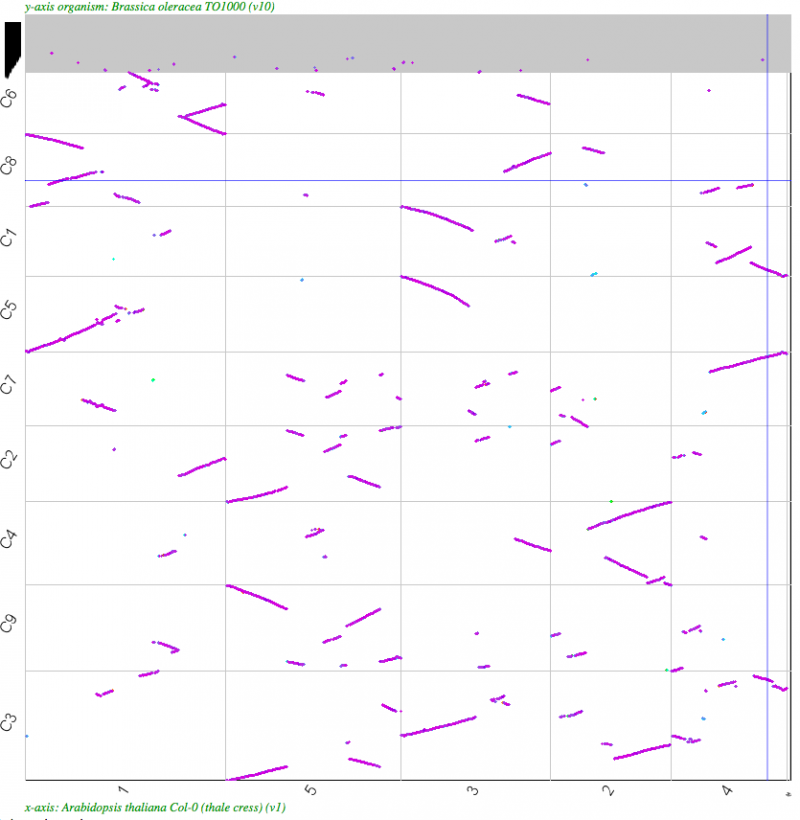
SynMap syntenic dotplot of A. thaliana (x-axis) v. B. oleracea (y-axis), screened forfor a 1:3 Arabidopsis thaliana to Brassica oleracea syntenic depth. This method, performed by quota align, identifies most of the orthologous syntenic gene-pairs. Results may be regenerated at http://genomevolution.org/r/4qg2