Expression Analysis Pipeline
From CoGepedia
CoGe can generate gene/transcript expression measurements given a FASTQ input and an annotated genome. Thanks to James Schnable, creator of qTeller, for help developing this pipeline!
Workflow
When a FASTQ file of sequence reads is loaded in LoadExperiment and associated with an annotated genome, the following analysis steps are performed:
- The FASTQ file is verified for correct format.
- CutAdapt is run to trim adapter sequence from the reads (parameters: -q 25 -m 17).
- -q: Trim low-quality ends from reads before adapter removal. The algorithm is the same as the one used by BWA (Subtract CUTOFF from all qualities; compute partial sums from all indices to the end of the sequence; cut sequence at the index at which the sum is minimal)
- -m: Discard trimmed reads that are shorter than LENGTH. Reads that are too short even before adapter removal are also discarded. In colorspace, an initial primer is not counted (default: 0).
- GMAP or Bowtie2 is run to index the reference genome sequence, depending on your choice.
- GSNAP or TopHat is run to align the reads to the reference sequence (GSNAP parameters: -N 1 -n 5 --format=sam -Q --gmap-mode=none --nofails, TopHat parameters: -g 1).
- SAMtools is run to compute per-position read depth of the resulting alignment (depth -q 20).
- Cufflinks is run to compte per-transcript FPKM (parameters: -p 24).
- The per-position read depth and per-transcript FPKM values are log transformed and normalized between 0 and 1 for loading.
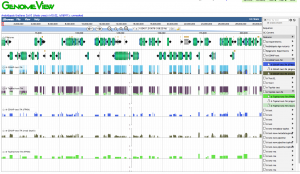
- The three results (raw alignment, per-position read depth, and per-transcript FPKM) are loaded as separate Experiments into a Notebook.
Genomes for which this analysis has been performed can have features imported into qTeller. TBD: how to do this ...
Video Tutorial
Demo fastq data for Arabidopsis Col-0:
- 0.17M reads: http://de.iplantcollaborative.org/dl/d/2F807292-34CC-4C8E-96E3-3E668A304D23/test_rna_seq_data_0.17M_reads.fastq
- 1M reads: http://de.iplantcollaborative.org/dl/d/EFD4F983-80B1-4388-94C4-AD78E73D2795/test_rna_seq_data_1M_reads.fastq
- 7.6M reads: http://de.iplantcollaborative.org/dl/d/9F6602D6-C66B-4C97-A72A-180AAE55AF95/test_rna_seq_data_7.6M_reads.fastq

