B.rapa versus A. thaliana
From CoGepedia
- Whole genome syntenic dotplot

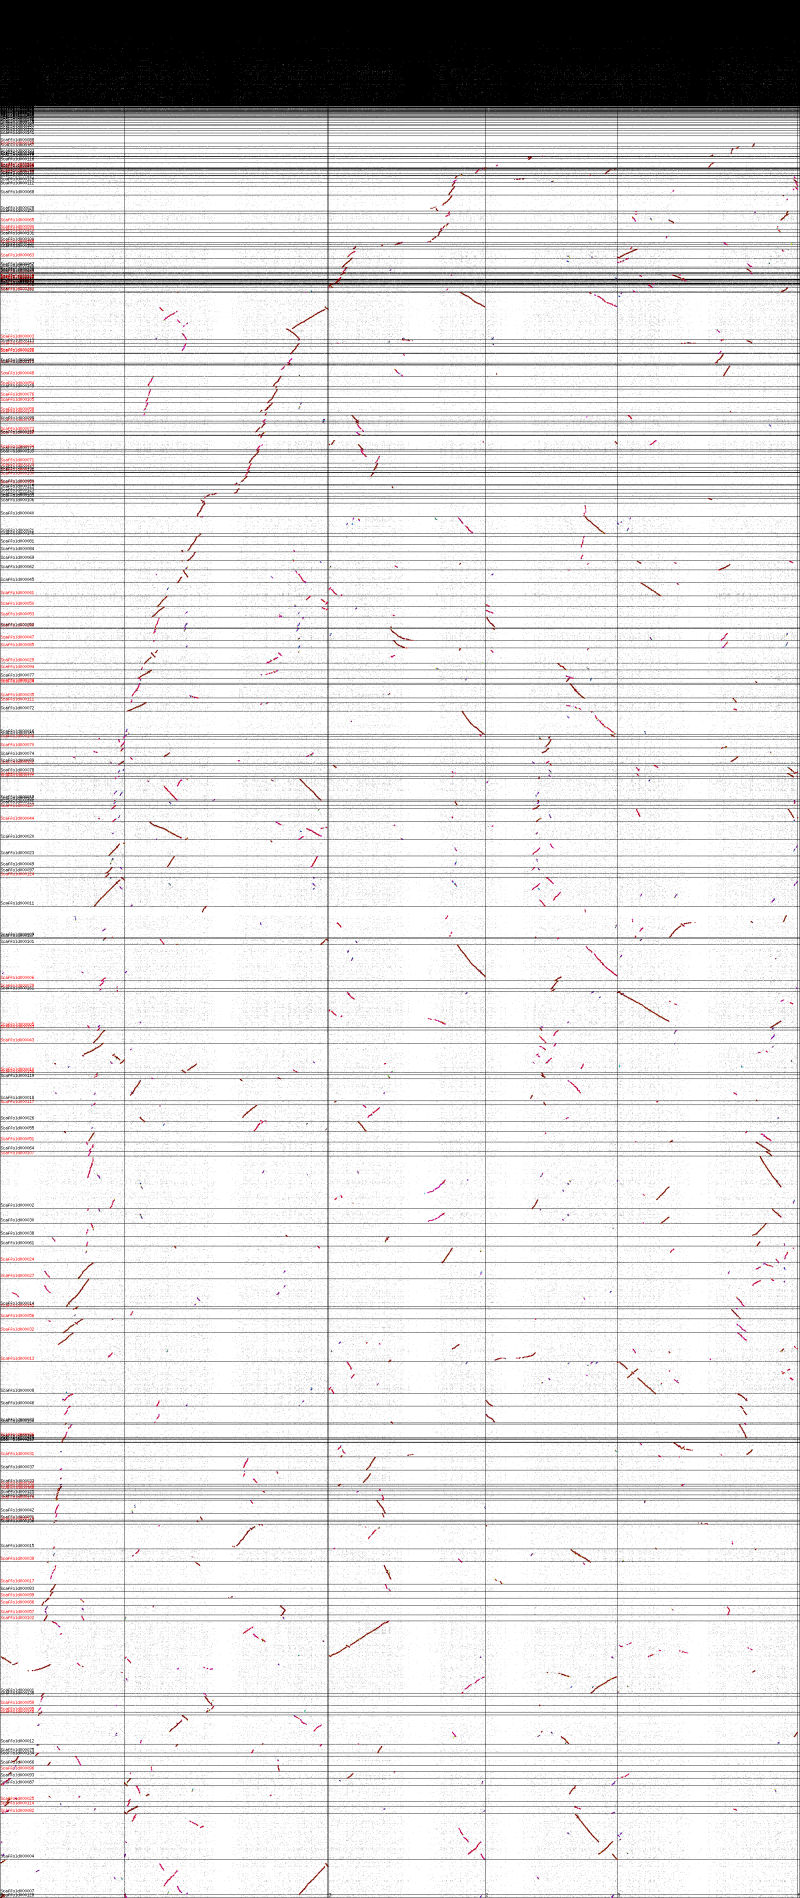
Syntenic dotplot between Brassica rapa and Arabidopsis thaliana. Syntenic gene-pairs are colored by Ks values. Dark red: orthologs; pink: from shared most recent whole genome duplication event; purple: from shared second most recent whole genome duplication event. Brassica's triploidy is seen by having each region of Arabidopsis thaliana having three dark red regions in B. rapa, while a single region of B. rapa has one dark red region in A. thaliana. Results can be regenerated at http://genomevolution.org/r/nty .

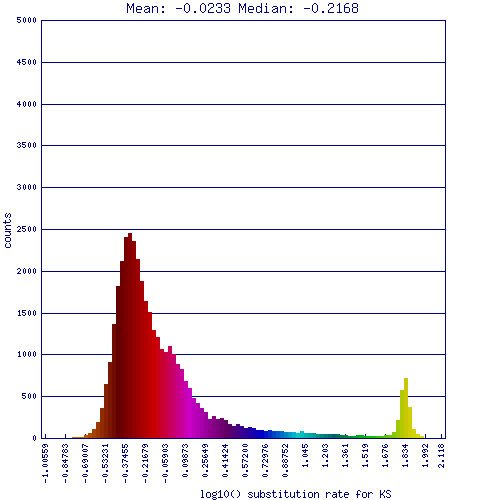
Histogram of Ks values between Brassica rapa and Arabidopsis thaliana. Ks values are log transformed, low values on left (little change); high values on right (more change). Peaks correspond to genome duplication events. Colors in this histogram match colors in the syntenic dotplot. Results may be regenerated at http://genomevolution.org/r/nty .
- High resolution comparison of syntenic regions

GEvo syntenic analysis between one regions of Arabidopsis thaliana (bottom panel) and three orthologous regions from Brassica rapa. Since the divergence of these lineages, B. rapa has had a whole genomic triplication. Each panel represents a genomic region. Dashed line separates the top and bottom strands of DNA. Gene models are drawn above and below the dash line if the genes are located on the top or bottom strand of DNA respectively. Colors of gene models represents protein coding sequence (green), mRNA (blue), and gene (gray). The protein coding sequences of these regions were compared using blastz, and regions of sequence similarity are shown by colored blocks for each pair-wise comparison. Transparent wedges have been drawn connecting regions of sequence similar in order to identify synteny through a collinear arrangement of genes. Note that the genomic region from A. thaliana contains nearly the entire gene content of all the B. rapa regions combined, while the B. rapa regions share a subset of genes with one another. This is due to gene loss following the triplication of the B. rapa genome through a process known as fractionation. Results can be regenerated at: http://genomevolution.org/r/2cqg.