CoGeBlast
 | |
| CoGeBlast Screenshot | |
| Software company | CoGe Team |
|---|---|
| Analysis Type | Blast query sequences against genomes stored in CoGe database |
| Working state | Released |
| Tools Utilized | blastn, tblastn, tblastx, blastz |
| Website | http://synteny.cnr.berkeley.edu/CoGe/CoGeBlast.pl |
CoGeBlast is CoGe's interface to BLAST (Basic Local Alignment Search Tool) and other related algorithms. With CoGeBlast, one can take any query sequence, whether user submitted or requested from the CoGe database, and compare it against any number of genomes in the CoGe database
Contents
Overview
CoGeBlast is a web-based interface to blast that allows you to quickly:
- Add query sequences
- Find and select any number of organisms and genomes in CoGe to search against
- Configure a blast analysis
- Visualize an overview of blast hits (High-scoring Sequence Pairs; HSP) in relationship to their genomic locations
- Interact with a sortable list of blast hits detailing
- which query sequence matched which organism
- their genomic location
- query sequence coverage
- variety of blast hit metrics (length, e-value, score, percent ID, quality)
- and allows you to find the closest genomic feature in the searched organisms
- Visualize individual hits in their genomic context to determine the extent to which you query matched
- Get sequence, alignment and positional information for a given hit
- An overview of the number of times your query sequences matched a given organism
- Links to data files including
- table of blast hits metrics and sequences
- fasta file of query Hit sequences
- fasta file of subject Hit sequences
- file of blast hit alignments
- raw blast reports for each organisms searched
- Ability to select identified genomic regions and:
- send to other programs in CoGe
- generate a fasta file of nearby genomic features
- export results to a tab delimited file or Microsoft Excel
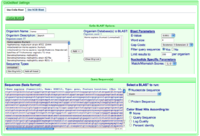
Configure Screen
Alignment Algorithms
CoGeBlast utilizes a number of variants of the BLAST algorithm originally developed by Altschul et al. [1]
Configuring CoGeBlast
Quick Run
To quickly run an analysis:
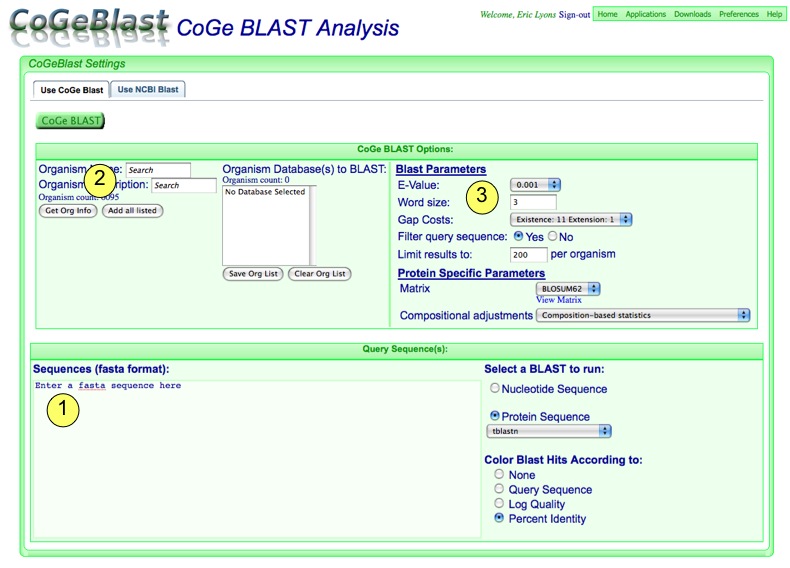
- Add query sequences
- Find and add organisms to search against
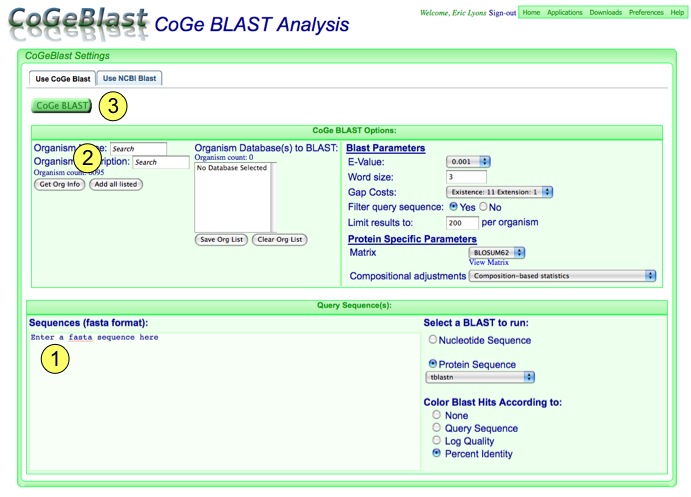
- Press the "CoGeBlast" button to start your analysis.
Detailed View
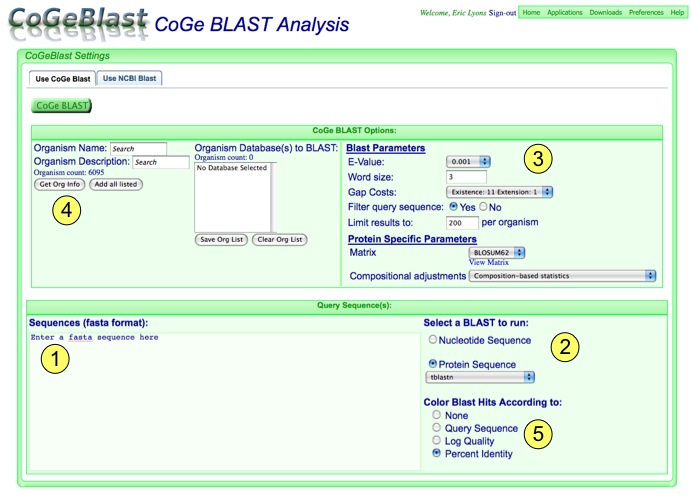
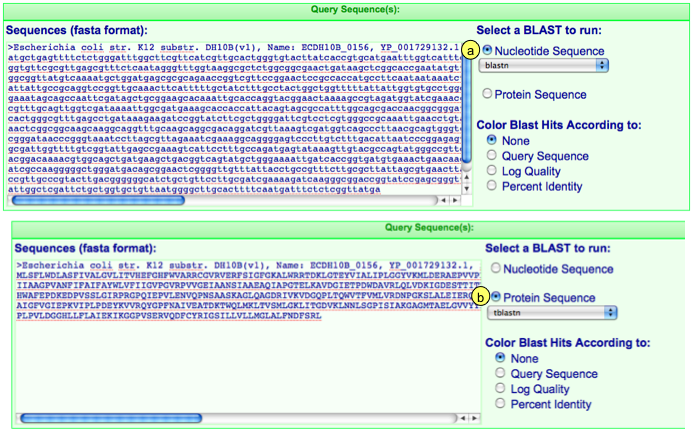
1. Adding Query Sequences:
Simply paste your sequences in this box. If you are searching with more than one sequence, make sure they are in fasta format:
>sequence 1 name
TAATATATCTGATGATGCTGACTGCATGCA

>sequence 2 name
TATGATCGTACGTACGTACGATCGTACGATCGT
Many tools in CoGe link to CoGeBlast and will automatically deposit sequences in this box. You can always replace those that have been automatically deposited or add additional sequence.
2. Select Blast analysis type:
If you have added in your own sequences, make sure to select whether they are protein or DNA sequences. If sequences have been added automatically, when you change the sequence type, the sequence in the box will change automatically as well.
For each sequence type, you can then select an appropriate blast algorithms. Blastb, tblastx, and blastz for nucleotide sequence; tblastn for protein sequence.
3. Configure blast parameters
Different blast algorithms have different parameters you can set. The ones in this area will change depending on the algorithm selected. Although an explanation of the meaning of the parameters are beyond the scope of this document, you can easily find the information elsewhere on the internet. However, one important configuration for CoGeBlast is "Limit results to:" which sets the upper limit to the number of blast hits displayed for each organism, regardless of how blast is configured. This limit is set so that if you blast a sequence that is highly repetitive, you do not overload your web-browser with results. You can change this limit as you see fit, and if more results were generated than were returned to your browser, you will be notified in the results. Also, the entire blast results file is available for downloading.
4. Select Organisms to Blast
There are many thousands of organisms in CoGe. To find those of interest, simply type their name (or a portion of their name) in the "Name" box or a description in the "Description" box. Most organisms have a description that follows NCBI's organism naming convention. For example:
Escherichia coli str. K12 substr. DH10B Bacteria; Proteobacteria; Gammaproteobacteria; Enterobacteriales; Enterobacteriaceae; Escherichia
This allows you to search descriptions for "gamma" and find all gammaproteobacteria (plus some other things). When you get the list of organisms back, you can add them to the search list by selecting them and pressing the "add" button, or double clicking on the organism name. If you want to add all from the search list, press "Add all listed".
5. Color Blast Hits According to:
You can color the blast hits that are displayed on the genomic overview of blast hits based on a few criteria:
- None: All hits are colored green
- Query Sequence: Each blast hits generating by a different query sequence is given a different color. This is useful if you are looking at the genomic distribution of a few different sequences.
- Log Quality: Each blast hit is colored based on its log normalized "quality" score. The quality score is calculated by multiplying the percent identity of the hit to its coverage of the query sequence (PERCENT_IT * PERCENT_QUERY_COVERAGE). The colors are displayed in a green-yellow-red gradient with green being the top score and red being the bottom score.
- Percent Identity: Each blast hit is colored based on its percent identity. The colors are displayed in a green-yellow-red gradient with green being the top score and red being the bottom score.
An example of such colors are show for Log Quality. Note that each organism's hit colors are normalized only to it:
Running an Analysis
Run CoGeBlast
When your analysis is configured, just press the "CoGeBlast" button!
While CoGeBlast is Running
While CoGeBlast is running, you'll see a spinning double helix of DNA at the top of the web-page, and a status report of what is happening behind the scenes in terms of finding or creating organisms' blastable databases, and blasting their genomes:
Results
CoGeBlast Results
When returned, your results will appear above the section where you configured your analysis:
- Is a graphical overview of the location of your blast hits in genomes searched. Those that had no hits will be listed at the bottom of this table.
- Interactive table of blast hits showing detailed information for each hit. Each column of the table is sortable, and can be hidden from view if not needed for interpreting your analysis.
- Overview table of the number of times each query sequence hit each organism. If the number of hits returned exceeded the limit as specified in the configuration of your analysis, there will be a notification in this table.
- Links to data files.
- (Not shown above). A detailed view of a blast hit in the context of the query sequence and the genomic region to which it matched.
1. Graphical Overview of Blast Hits
The graphics overview of hits shows the genomic position of where a query sequence matched an organism's genome by drawing a chromosome (or contig) and adding triangular tick marks. This tick marks are drawn above or below the chromosome depending if the blast hits are in the (++) or (+-) orientation respectively. If one of the options for coloring blast hits has been selected, the blast hits will be colored on a green-yellow-red scale. Otherwise they are colored green. In the image above, the left and right panel show blast hits to the same two genomes, E. coli 101-1 (which is not fully assembled), and E. coli ATCC 8739 (which is fully assembled). The panel on the right has its blast hits colored by log normalized Quality Scores. Otherwise, the two panels show the same information.
Each image has a link to the blast report above it, and a link to a larger picture below it. Also, if you click on a blast hit, you will generate detailed HSP graphic will appear (which is discussed below).
2. Table of Blast HSPs (hits)
This table lists all the blast hits returned (up to the limit imposed in the blast parameters) containing the following information:
- Query Seq: Name of the query sequence submitted that generated the blast hit.
- Org: Organism to which the query sequence matched.
- Chr: The chromosome in the organism in which the blast hit resides.
- Position: Chromosomal start position of the blast hit.
- HSP#: The number (rank) of the blast hit. The lower the number, the higher the rank. E.g. HSP 1 was the most significant blast hit returned when blasting that organism. Each organism returning a blast hit will have an HSP 1. The blast hit number is a link that will generate a detailed HSP graphic (which is discussed below).
- Length: Length of the blast hit.
- Coverage: Percent of the query sequence covered by the blast hit.
- E-value: expect value for the blast hit.
- Perc ID: Percent sequence identity between the regions matched by the blast hit.
- Score: The score of the hit as reported by blast.
- Quality: The coverage of the hit multiplied by the percent sequence identity of the hit (PercID*Coverage). Range from 0-100.
- Closest Genomic Feature: This is a link that will find the closest genomic feature (e.g. gene) to the blast hit.
- Distance(bp): Distance from the blast hit to the closest genomic feature.
This table is sortable and clicking on the top of each column will cause the table to sort by the values in that column. If you wish to sort using multiple columns, click the column for your primary sort first, then hold the <shift> key and then click the column(s) of the secondary, tertiary, etc. By default, the results are returned sorted by organism name first, then HSP number. You can hide columns by checking the "Show HSP Table Column display options" and unchecking columns you wish to hide.
This shows an example with most of the columns hidden and the results sorted by "Quality".
3. Table of HSP counts
This table shows an overview of the number of times each query sequence hit each organism. If the total number of hits exceeded the limit specified in the blast options, you will be notified in this table:
In this example, 7 transposon sequences from Arabidopsis thaliana were blasted against the genomes of A. lyrata and A. thaliana. Only the top 200 blast hits are shown for each organism in the HSP table and genomic overview of blast hits.
4.Links to data downloads
In this area, you can download the data and results generated by your blast analysis including:
- raw blast reports
- a table of the hsp data
- fasta file of matched regions from your query sequences
- fasta file of matched regions from the organisms searched
- the SQLite database which is used to store the blast data to generate the graphics
- A log file which details each step of your analysis, which is useful if you think there was a problem with your analysis
5. Detailed view of blast hit
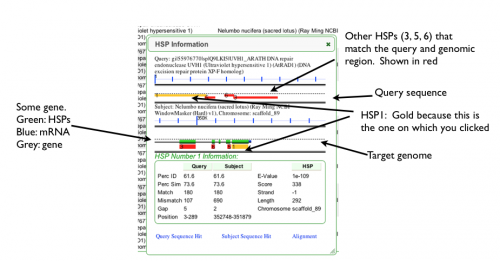
When you click on a tick mark in the genomic overview of blast hits or the HSP number in the HSP table, a new panel will appear on the web-page between these regions. This panel shows a detailed overview of your blast hit:
- This graphic shows your query sequence with the blast hit drawn on it as a colored block. For the blast hit you clicked, the colored block will be colored yellow. If the blast hit is in the (+/+) orientation, the blast hit is drawn above the dashed line, and if it is in the (+/-) orientation, it is drawn below the dashed line.
- This graphic shows the genomic region to which your query sequence matched. This region is extended beyond the blast hit, and underlying genomic features are drawn (if available). These features are colored green for CDS, blue for mRNA, and grey for RNA genes (e.g. rRNA, tRNA) and full genes with introns (not shown in picture above). Gene models above the dashed line are 5' to the left, and gene models below the dashed line are 5' to the right.
- Detailed information about the blast hit.
- Links to view the blast hit for the query and subject sequences, as well as the alignment.
In this example. HSP1 was clicked to generate the graphics. Now, when the genomic region matching the blast hit is retrieved and extended, CoGeBlast finds all other blast hits between that entire genomic region and the query sequence. Each of these blast hits is colored red. This type of visualization allows you to quickly evaluate the coverage and quality of how well the entire query sequence matches a genomic region. Also, this visualization allows you to identify genomic regions that may have annotation errors and omission. Here there is a region is sequence conservation in the genome that does not have a gene model, and may represent a missed annotation.
Tutorials
References
- ↑ Altschul SF, Gish W, Miller W, Myers EW, Lipman DJ (1990). "Basic local alignment search tool". J Mol Biol 215 (3): 403–410.doi:. PMID 2231712. http://www-math.mit.edu/~lippert/18.417/papers/altschuletal1990.pdf.
