Fractionation Mutagenesis
What is fractionation mutagenesis?
Fractionation mutagenesis is the creation of novel proteins or patterns of gene expression/regulation as a result of fractionation (the deletion of redundant sequences -- both protein coding and regulatory) following a whole genome duplication.
Natural Promoter Bashing
Natural promoter bashing is a technique for developing testable hypothesis about the function of promoter regions or conserved promoter elements by taking advantage of fractionation mutagenesis using a combination of comparative genomics and comparative expression studies.
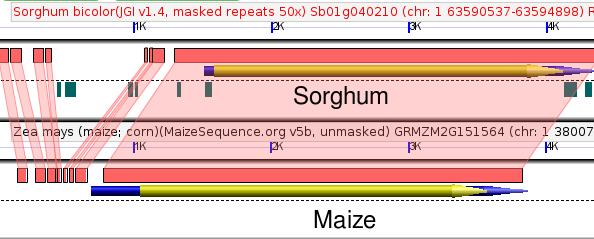
Whole genome duplications create two copies of every gene in a genome, each copy with identical promoters containing identical regulatory elements. We already know that duplicate copies of many genes are lost following whole genome duplications, usually by short to medium sized deletions. Genomes of species like maize, where a whole genome duplication occurred 5-12 million years ago, still contain gene fragments that show evidence of "bites" taken out of them. (Should I show an example of this?)
Deletions are not confined to the coding regions of genes but can also remove regions of upstream regulatory sequence.
Natural promoter bashing starts by identifying duplicate genes which show dissimilar patterns of expression with regards to some criteria a researcher is interested in. Perhaps one copy of the gene is expressed only in a certain cell type and the other is not. Or one gene is upregulated in response to a stimulus like drought stress and the other is not. Or one gene shows a change of expression in a mutant background and the other does not.
It is important that the difference observed is a difference in pattern of expression rather than absolute level of expression. Whole genome duplicates can show identical patterns of expression while being expressed at very different absolute levels. It is thought that these differences are mediated by chromatin environment rather than specific deletions/insertions in promoters of one gene or the other.
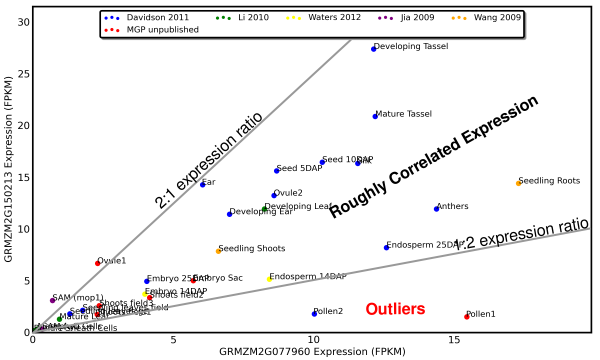
For this example we will use a duplicate pair of genes in maize which show a generally correlated pattern of expression in different tissues, except for pollen.
Note that the exceptional ratio of expression of this gene pair in pollen is supported by two different datapoints from two different research groups.
Based on this pattern of expression we can hypothesize that GRMZM2G150213 (y-axis) has lost a pollen specific enhancer or GRMZM2G077960 (x-axis) has lost an pollen specific repressor. Both of the models proposed above make assumption that a a regulatory sequence has been LOST from one gene rather than one gene gaining a new piece of regulatory DNA. While loss of function mutations should be much more common than gain of function ones, check out the "Gotchas to Look Out For" section below.
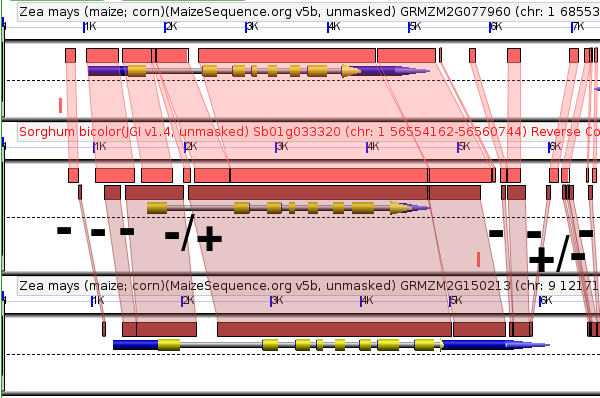
To track changes in the promoter sequence surrounding these two genes we can compare both genes to their shared sorghum ortholog. Sorghum diverged from maize around the same time as the maize whole genome duplication, so even functionless sequence should still show some detectable similarity between sorghum and maize (assuming it hasn't been deleted). Here is the comparison in GEvo:
As you can see there are multiple short deletions (marked with a "-" in the above figure or combined insertion/deletions (marked with a "+/-") which have occurred around GRMZM2G077960. How can we prioritize which deletions are most likely to contain regulatory sequences?
Messing with the sequence of regulatory sequences tends to have bad effects on plants, so their sequence tends to change more slowly than that of random functionless DNA. (This is the same reason that exons will show greater similarity between homologous genes than introns.) So by comparing the sequence surrounding our maize-sorghum-maize gene triplet to the sequence surrounding orthologous genes in other grass species (in this case foxtail millet, rice, and brachypodium) we can identify regions of sequence which are changing much more slowly than expected of functionless DNA. If any of those slow changing sequences overlap with the deletions we've already identified, we will have a candidate promoter regulatory region.
The full GEvo panel comparing six grass genes to each other is a lot of information to take in at once, so instead I've zoomed in to focus just on the sorghum sequence and any regions identified as having similar sequence in other grasses:
As you can see we've gone from eight candidate regulatory regions down to only two, with one (the five prime case) being the more likely of the two.
Identifying Gene Pairs
The easiest way to identify homeologous gene pairs is probably to use SynMap with appropriate QuotaAlign filters. But other approaches to identifying homeologous gene pairs, such as approaches based on phylogeny of individual gene families could potentially work as well.
For working on natural promoter bashing in the grasses, this spreadsheet listing syntenic orthologs in Sorghum, Setaria, Rice, and Brachypodium for genes in the maize B73_refgen2 FGS gene set may be useful:
http://data.iplantcollaborative.org/quickshare/d37066cd20a105e8/grass_syntenic_orthologs.xls
Defining Conserved Promoter Elements
Identifying conserved noncoding sequences by hand is feasible for a handful of genes (or even a few dozen) but when dealing with thousands of gene pairs, manual examination becomes impractical (unless you have a co-worker you REALLY hate that you can talk into doing it for you.)
The favored approach in the Freeling Lab to identifying conserved noncoding sequences in an automated fashion is our CNS Discovery Pipeline.


