Variant data
From CoGepedia
EPIC-CoGe's genome browser supports the visualization of variant data on any genome in CoGe.
You can load and visualize variant data by:
- Loading a VCF file for a genome using LoadExperiment
- Note: One loaded file in coge is called an experiment
- Using GenomeView to browse the genome
- Select the appropriate experiment for visualization
Contents
- 1 Visualizing Variant Data
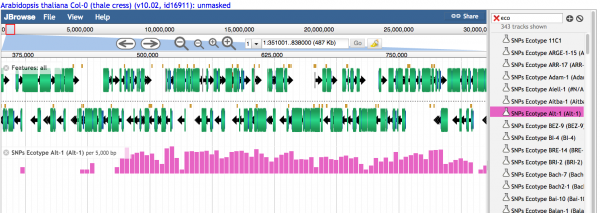
- 1.1 Histograms showing the relative number of variants are visualized when the density is high
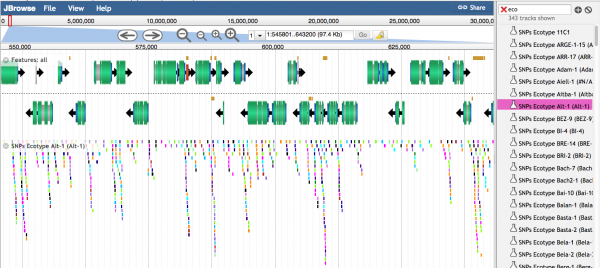
- 1.2 Individual variants are seen when the density of variants is lower. Different colors represent different types of SNPs
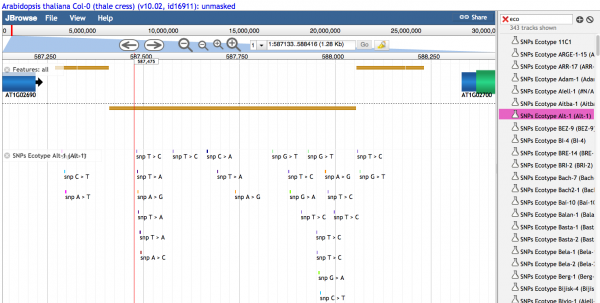
- 1.3 Text describing the variant is seen when density of variants is sufficiently low.


