Difference between revisions of "EPIC-CoGe"
(→Screenshots) |
(→Overview) |
||
| (32 intermediate revisions by 2 users not shown) | |||
| Line 3: | Line 3: | ||
[[Image:Screen Shot 2013-01-02 at 6.30.39 PM.png|thumb|right|300px|Funding for the EPIC-CoGe Browser Project is provided by: [http://www.moore.org/ The Gordon and Betty Moore Foundation]]] | [[Image:Screen Shot 2013-01-02 at 6.30.39 PM.png|thumb|right|300px|Funding for the EPIC-CoGe Browser Project is provided by: [http://www.moore.org/ The Gordon and Betty Moore Foundation]]] | ||
| + | [[File:9794027 orig.jpg|thumb|right|300px|Funding for the EPIC-CoGe Browser Project is provided by: [http://www.csrees.usda.gov/ The USDA/NIFA]]] | ||
| + | ==Overview== | ||
| + | EPIC-CoGe, also known as GenomeView in CoGe, is a genomic visualization tool based on [http://jbrowse.org JBrowse]. | ||
| − | + | CoGe provides data management and visualization tools to let anyone | |
| − | + | * add new genomes | |
| − | + | * add function (E.g., RNAseq, methylation) and diversity (SNPs, haplotype) data to those genomes | |
| + | * Keep gnomes and data private or make them fully public | ||
| + | * Share them with collaborators | ||
| + | * Integrate with public data | ||
| + | * visualize them in an interactive genome browser ([[GenomeView]] aka EPIC-CoGe) | ||
| + | * perform advanced data analysis | ||
| − | + | EPIC-CoGe contains many features for analyzing data in CoGe: | |
| − | + | * search for features by name or partial name | |
| + | * search tracks for min, max or a range of values | ||
| + | * search for data that overlaps certain types of features | ||
| + | * save search results as new experiments in CoGe | ||
| + | * find data in a track that overlaps data in another track | ||
| + | * find data in a track that doesn't overlap data in another track | ||
| + | * overlay multiple tracks together | ||
| + | * create new notebook in CoGe that contains overlaid tracks (experiments) | ||
| + | * rename and delete experiments from inside EPIC-CoGe | ||
| + | * rename, delete, add experiments to, and remove experiments from notebooks from inside EPIC-CoGe | ||
| + | * temporarily transform data | ||
| + | * toggle track scale between max in chromosome and max in view | ||
| − | == | + | ==Reference== |
| − | [[ | + | [[EPIC CoGe Reference]] |
| − | + | ||
| − | [[ | + | ==Tutorial== |
| + | See the [[EPIC-CoGe Tutorial]] for videos and step-by-step instructions for getting started. | ||
| − | == | + | ==Try== |
| + | This link will take you to EPIC-CoGe loaded with ''Arabidopsis thaliana'': http://genomevolution.org/r/939v. | ||
| − | + | ==Embed== | |
| + | [[Embedding CoGe JBrowse in your website|Embedding EPIC-CoGe in your website]] | ||
| − | + | ==Videos== | |
| − | + | [[EPIC-CoGe Videos]] | |
| − | + | ||
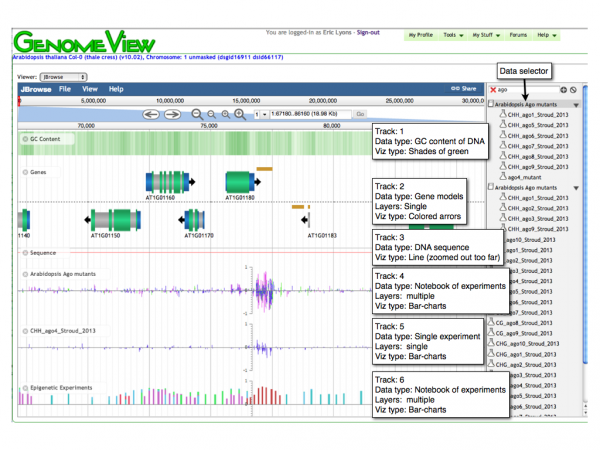
| + | ==Screenshots== | ||
| + | [[Image:Untitled.001.png|none|600px|link=http://genomevolution.org/r/939v]] | ||
| + | [[File:Screen Shot 2014-02-20 at 9.18.15 AM.png|thumb|none|600px|Visualization of Diversity and Functional Genomics Data. Note that SNP density is viewed as histograms.]] | ||
| + | [[File:Screen Shot 2014-02-20 at 9.17.40 AM.png|thumb|none|600px|Visualization of Diversity and Functional Genomics Data. Note that individual SNPs are visualized at higher zoom levels.]] | ||
| + | <!-- [[Image:Screen Shot 2013-01-02 at 6.28.02 PM.png|thumb|none|600px|Prototype version of quantitative visualization using CoGe's genome browser based on [http://openlayers.org OpenLayers] ]] --> | ||
| + | ==Navigation== | ||
| − | == | + | === Panning left-right === |
| + | There are several ways to move along a genomic region: | ||
| + | |||
| + | *Click on the track and drag with mouse | ||
| + | *Use the left/right arrows located on the left of the viewer | ||
| + | *Click a location in the macro or micro coordinate bars at the top of the viewer. | ||
| + | *Enter a chromosome/start/end location in the location input bar at the top of the viewer. | ||
| + | |||
| + | === Zooming in and out === | ||
| + | You can zoom into and out of a genomic region by: | ||
| + | |||
| + | *Click the (+) and (-) magnifying glass icons at the top of the viewer. | ||
| + | *Double-clicking on a region will zoom in one level | ||
| + | |||
| + | === Selecting Tracks === | ||
| + | Use the track selector menu on the right of the viewer to add or remove tracks to the current view. | ||
| + | <!-- | ||
| + | |||
| + | =What do the colors and glyphs mean= | ||
| + | See this page: [[GenomeView examples]] | ||
| + | |||
| + | = Getting additional information and data = | ||
| + | |||
| + | === Annotations === | ||
| + | |||
| + | *Full Genomic Feature Annotations: Simply click on a feature, and a window will appear with the complete annotation for all features at that location. This window is resizeable and draggable. Please see [[Annotation information]], for more information about the information and links provided in this view. | ||
| + | *Popup-annotations: Select the "Pop-up Annotations" in the lower right hand part of the navigation screen, and the names of genomic features will pop-up when the mouse pointer hovers over them for a second. This window is resizable and draggable. | ||
| + | *Genome Information: Click on the "Genome Info" button in the lower left hand part of the navigation screen and an overview of the genome will pop-up. | ||
| + | |||
| + | <font color="red">Note:</font> many of the annotations contain links to other parts of CoGe. For example, if you want to get the sequence of a feature, just click on its location information in the pop-up annotation window. | ||
| + | |||
| + | === Grab Sequence === | ||
| + | |||
| + | [[Image:GenomeView-get seq.png|thumb|center|600px]] To get genomic sequence in fasta format: | ||
| + | |||
| + | #Click "Grab Sequence" button in lower left of navigation screen. | ||
| + | #Click two regions in the genomic view to set the start and stop positions of the sequence you wish to grab. | ||
| + | #Click "View Sequence" to launch [[SeqView]] and get the sequence of the selected region in fasta format. | ||
| + | |||
| + | === Extract Genomic Features === | ||
| + | |||
| + | [[Image:GenomeView-get feats.png|thumb|center|600px]] To genomic features: | ||
| + | |||
| + | #Click "Extract Features" button in lower left of navigation screen. | ||
| + | #Click two regions in the genomic view to set the start and stop positions of the sequence you wish to grab. | ||
| + | #Click "Get Features" to launch [[FeatList]] and get a list of all genomic features in the selected region. | ||
| + | |||
| + | = Understanding the image = | ||
| + | |||
| + | CoGe's genomic visualization library, [[GeLo]], permits the creation of a virtual chromosome using any style of glyphs to represent genomic information. Below are the common implementations used in CoGe | ||
| + | |||
| + | === Genomic Features === | ||
| + | |||
| + | Genomic features are usually drawn as arrows or blocks of varying size and color. While there is some variation in how such features are drawn due to difference in how they were specified in the original data source (e.g. do mRNAs include introns?), the general conventions used in CoGe are: | ||
| + | |||
| + | *Grey (narrow): Gene. Usually starting at the beginning of the transcript, stopping at the end of the transcript, and including all intronic sequence, if appropriate. | ||
| + | *blue: mRNA transcript | ||
| + | *Green: CDS/protein coding regions (Please see note below) | ||
| + | *grey (large): RNA gene (tRNA, rRNA, etc.) | ||
| + | *orange-red: pseudogene | ||
| + | |||
| + | <font color="red">Note: </font>There are options in CoGe to color protein coding regions (CDS) based on the GC content of the wobble position in the codon. If this visualization is use, a color gradient is used to depict the wobble GC content such that: | ||
| + | |||
| + | *red: AT rich in CDS wobble positions | ||
| + | *green: GC rich in CDS wobble positions | ||
| + | *yellow: 50%/50% AT/GC in CDS wobble positions | ||
| + | |||
| + | === Background of virtual chromosome === | ||
| + | |||
| + | The background of a genomic image can also be colored. Most often, this is used to color the genomic GC content such that: | ||
| + | |||
| + | *green: GC rich | ||
| + | *white: AT rich | ||
| + | *orange: Unsequenced (N) | ||
| + | *purple: masked sequenced (X). Masked genomes are generated often to remove repetitive sequence. | ||
| + | |||
| + | === Expanding overlapping genomic features === | ||
| + | |||
| + | When genomic features overlap, as happens with alternatively spliced transcripts, you often have the option of drawn these on top of one another, or have CoGe detect this and drawn them above and below one another. | ||
| + | |||
| + | *Select "Expand Overlapping Gene Models" in the lower right of the screen to turn this on | ||
| + | |||
| + | === Examples and descriptions of GenomeView's visualization === | ||
| + | |||
| + | As there are many different types of visualization, please follow this link: [[GenomeView examples]]. | ||
| + | |||
| + | = Other options = | ||
| + | |||
| + | === Flat Gene Models === | ||
| + | |||
| + | Flat gene models are simple arrows without the "tubular" design. This was the original way gene models were drawn before Josh Kane updated the model. | ||
| + | |||
| + | === Expand Gene Models === | ||
| + | |||
| + | Separates genomic features that overlap at the same genomic position. Usually happens when alternatively spliced transcripts are annotated. | ||
| + | |||
| + | === Save Settings === | ||
| + | |||
| + | Registered users can save which information they want to see by default as well as how gene models are drawn" | ||
| + | |||
| + | === Window Width === | ||
| + | |||
| + | Sets the size of the window used for navigating a genomic region. Options in the top-left of navigation window | ||
| + | |||
| + | *Resize: sets the navigation window to the size specified in the "Window Width" box (in pixels) | ||
| + | *Full Screen: sets the navigation window to the size of the browser window | ||
| + | |||
| + | = Linking to GenomeView = | ||
| + | |||
| + | See [[Linking to GenomeView]] for information on how to link to GenomeView. | ||
| + | |||
| + | <br> | ||
| + | |||
| + | <br> | ||
| + | |||
| + | = Examples = | ||
| + | |||
| + | === Identifying Horizontal Gene Transfer using GC content in wobble position coloring === | ||
| + | |||
| + | [[Horizontal Gene Transfer]] | ||
| − | + | --> | |
== Long-term vision == | == Long-term vision == | ||
| − | * | + | *While originally developed for Arabidopsis, EPIC-CoGe is now extend to all genomes in CoGe |
*Permit users to upload their own data, keep it private, share with collaborators, and make public upon publication | *Permit users to upload their own data, keep it private, share with collaborators, and make public upon publication | ||
*Expand data storage engine to include all types of quantitative genomic data including | *Expand data storage engine to include all types of quantitative genomic data including | ||
| Line 63: | Line 208: | ||
By leveraging these resources provided by the NSF, the support of the Betty and Gordon Moore Foundation for the first two years of the EPIC-CoGe Browser development will create the synergistic glue required to make epigenetic data available to the widest group of international researchers. Such support will be leveraged for the long-term viability of all three projects through new funding opportunities from domestic, international, and industrial partnerships. Currently, Co-PIs Lyons and Gregory have a proposal with the NSF Plant Genome Research Program to provide support for this project starting in year three and focused on rice epigentic data. In addition, a functional prototype EPIC-CoGe Browser has been deployed: http://genomevolution.org/CoGe/GenomeView.pl?gid=16911&viewer=JBrowse | By leveraging these resources provided by the NSF, the support of the Betty and Gordon Moore Foundation for the first two years of the EPIC-CoGe Browser development will create the synergistic glue required to make epigenetic data available to the widest group of international researchers. Such support will be leveraged for the long-term viability of all three projects through new funding opportunities from domestic, international, and industrial partnerships. Currently, Co-PIs Lyons and Gregory have a proposal with the NSF Plant Genome Research Program to provide support for this project starting in year three and focused on rice epigentic data. In addition, a functional prototype EPIC-CoGe Browser has been deployed: http://genomevolution.org/CoGe/GenomeView.pl?gid=16911&viewer=JBrowse | ||
| − | + | If you have any feedback, please [mailto:coge.genome@gmail.com email the CoGe Team.] | |
Support from GBMF will ensure the completion of the goals outlined above and provide much needed resources for the international epigenetics community. | Support from GBMF will ensure the completion of the goals outlined above and provide much needed resources for the international epigenetics community. | ||
| + | |||
| + | ==Adding data== | ||
| + | You can add data to EPIC-CoGe. All you need is: | ||
| + | * A [[user account]] | ||
| + | |||
| + | Then use [[LoadExperiment]] to add your data to a genome in CoGe. | ||
| + | *Note: [[LoadExperiment]] also describes the data format for EPIC-CoGe | ||
==Support== | ==Support== | ||
This web site is funded by the [http://www.moore.org Gordon and Betty Moore Foundation] through Grant GBMF3383 to Eric Lyons. This project is a collaboration between the labs of [http://cals.arizona.edu/spls/node/469 Eric Lyons] at the University of Arizona and [http://www.bio.upenn.edu/people/brian-gregory Brian Gregrory] at the University of Pennsylvania. | This web site is funded by the [http://www.moore.org Gordon and Betty Moore Foundation] through Grant GBMF3383 to Eric Lyons. This project is a collaboration between the labs of [http://cals.arizona.edu/spls/node/469 Eric Lyons] at the University of Arizona and [http://www.bio.upenn.edu/people/brian-gregory Brian Gregrory] at the University of Pennsylvania. | ||
Latest revision as of 12:32, 15 September 2016


Contents
Overview
EPIC-CoGe, also known as GenomeView in CoGe, is a genomic visualization tool based on JBrowse.
CoGe provides data management and visualization tools to let anyone
- add new genomes
- add function (E.g., RNAseq, methylation) and diversity (SNPs, haplotype) data to those genomes
- Keep gnomes and data private or make them fully public
- Share them with collaborators
- Integrate with public data
- visualize them in an interactive genome browser (GenomeView aka EPIC-CoGe)
- perform advanced data analysis
EPIC-CoGe contains many features for analyzing data in CoGe:
- search for features by name or partial name
- search tracks for min, max or a range of values
- search for data that overlaps certain types of features
- save search results as new experiments in CoGe
- find data in a track that overlaps data in another track
- find data in a track that doesn't overlap data in another track
- overlay multiple tracks together
- create new notebook in CoGe that contains overlaid tracks (experiments)
- rename and delete experiments from inside EPIC-CoGe
- rename, delete, add experiments to, and remove experiments from notebooks from inside EPIC-CoGe
- temporarily transform data
- toggle track scale between max in chromosome and max in view
Reference
Tutorial
See the EPIC-CoGe Tutorial for videos and step-by-step instructions for getting started.
Try
This link will take you to EPIC-CoGe loaded with Arabidopsis thaliana: http://genomevolution.org/r/939v.
Embed
Embedding EPIC-CoGe in your website
Videos
Screenshots


Panning left-right
There are several ways to move along a genomic region:
- Click on the track and drag with mouse
- Use the left/right arrows located on the left of the viewer
- Click a location in the macro or micro coordinate bars at the top of the viewer.
- Enter a chromosome/start/end location in the location input bar at the top of the viewer.
Zooming in and out
You can zoom into and out of a genomic region by:
- Click the (+) and (-) magnifying glass icons at the top of the viewer.
- Double-clicking on a region will zoom in one level
Selecting Tracks
Use the track selector menu on the right of the viewer to add or remove tracks to the current view.
Long-term vision
- While originally developed for Arabidopsis, EPIC-CoGe is now extend to all genomes in CoGe
- Permit users to upload their own data, keep it private, share with collaborators, and make public upon publication
- Expand data storage engine to include all types of quantitative genomic data including
- Expression profiles
- RNASeq
- Copy number variation
- SNPs
- QTLs
Summary
How eukaryotic organisms regulate mRNA levels is a fundamental question in biology. Most of the early attention was focused on the study of gene transcription, while only recently posttranscriptional mechanisms have gained recognition for their regulatory importance. These epigenetic regulatory pathways control mRNA levels both transcriptionally and posttranscriptionally, and pioneering work in Arabidopsis thaliana has helped define these processes. For this reason, there is a wealth of epigenomic information already available for this model plant. However, it is almost entirely unusable to the wider research community due to the computational intensive procedures needed to leverage these data resources. For this reason, we will develop an easy to use web-based system to store, access, and visualize Arabidopsis epigenetic data in a comparative genomics context: the EPIC-CoGe Browser.
The EPIC-CoGe Browser will consist of four major subsystems:
- A data storage subsystem that can store thousands of epigenetic experiments and provide rapid access to those data.
- A web-based visualization subsystem that permits overlaying and partitioning of epigenetics data on genomic data.
- A user interface subsystem to allow researchers to find and select sets of epigenetic experiments for visualization.
- A user interface subsystem to allow researchers to customize how to mesh and visualize their selected epigenetics experiments.
The EPIC-CoGe Browser will synthesize existing investments from three NSF funded projects: EPIC, CoGe, and the iPlant Collaborative. EPIC, whose mission is “reading the second [genetic] code [of life by] mapping epigenomes to understand plant growth, development and adaptation to the environment,” is currently funded as a Research Coordination Network. Their primary goal has been to coordinate the research activities of the international community and develop a whitepaper to drive this effort. However, this community currently lacks a computational browser to access and visualize epigenetic data. Also, their research interests are diverse. While much of the epigenetic community originally focused on the model plant system, Arabidopsis thaliana, the community research interests span all plants, including those of agronomic importance for global food safety and sustainability. However, to achieve such broad applicability, the EPIC-CoGe Browser requires scalable computing resources and data management systems.
The iPlant Collaborative is a large investment by the NSF to create cyberinfrastructure (CI) for the plant research community. Cyberinfrastructure is made up of extensible, scalable, and capable computing resources, and “domain expertise”, which includes computer science, mathematics, statistics, algorithms, and all disciplines of plant biology. iPlant is building and deploying the software systems necessary to connect supercomputing resources (XSEDE) to computational biologists, bench biologists, field biologists, and plant breeders. The comparative genomics platform, CoGe, is part of the “powered by iPlant” program. CoGe utilizes iPlant’s CI in order to achieve the scalability necessary to serve the entire comparative genomics community for all domains of life (CoGe currently makes available 16,500 genomes from ~13,000 organisms). In addition, CoGe provides a suite of web-based tools for in-depth analyses and comparisons of genomic data. The EPIC-CoGe Browser will be an extension of CoGe and likewise a member of the Powered by iPlant program to access the required scalable and capable computational resources.
While year one of this project will focus on public epigenetics data for Arabidopsis thaliana and developing the four subsystems described above, as the technology continues to improve for amassing epigenetics data easily and inexpensively, the need for the EPIC-CoGe Browser will continue to grow as more plant species are investigated. Year two of the project will focus on catering to the needs of the epigenetic research community by: 1. providing researchers with more data management and collaboration tools, 2. supporting additional organisms, and 3. supporting advanced comparative analyses and publication quality images. Data management and collaboration tools are required for on-going research with pre-publication data. These systems will permit researchers to add their own data to EPIC-CoGe, share those data among a group of researchers, and restrict their public access, while also being able to engage the broader community for soliciting help and analytical expertise. EPIC-CoGe will engage the rice and maize research communities in order to expand EPIC-CoGe Browser’s capabilities into additional species, and specifically those with agronomic and food safety importance. By being based on the CoGe system, which inherently supports thousands of organisms, these examples will permit the expansion of EPIC-CoGe to all domains of life. In addition, CoGe provides many tools for comparative genomics, and the data visualizations of EPIC-CoGe will be adapted for use in these tools. This synthesis of data and analytical tools will permit information from well-studied plants to be leveraged for less understood plants.
In order to best meet the needs of the plant epigenetic research community, year two will also focus on soliciting feedback from scientists through online questionnaires, discussion forums, and workshops. The workshops will be held at national and international conferences that the Co-PIs regularly attend: Gregory at the International Conference on Arabidopsis Research, and Lyons at the Annual Maize Genetics Conference.
By leveraging these resources provided by the NSF, the support of the Betty and Gordon Moore Foundation for the first two years of the EPIC-CoGe Browser development will create the synergistic glue required to make epigenetic data available to the widest group of international researchers. Such support will be leveraged for the long-term viability of all three projects through new funding opportunities from domestic, international, and industrial partnerships. Currently, Co-PIs Lyons and Gregory have a proposal with the NSF Plant Genome Research Program to provide support for this project starting in year three and focused on rice epigentic data. In addition, a functional prototype EPIC-CoGe Browser has been deployed: http://genomevolution.org/CoGe/GenomeView.pl?gid=16911&viewer=JBrowse
If you have any feedback, please email the CoGe Team.
Support from GBMF will ensure the completion of the goals outlined above and provide much needed resources for the international epigenetics community.
Adding data
You can add data to EPIC-CoGe. All you need is:
Then use LoadExperiment to add your data to a genome in CoGe.
- Note: LoadExperiment also describes the data format for EPIC-CoGe
Support
This web site is funded by the Gordon and Betty Moore Foundation through Grant GBMF3383 to Eric Lyons. This project is a collaboration between the labs of Eric Lyons at the University of Arizona and Brian Gregrory at the University of Pennsylvania.