CoGe's genome visualization library, GeLo, is very flexible in the types of graphics it can produce. The best way to figure out what something means in an image from CoGe is to scroll through this list of images, find something that looks similar, and then read the description.
Overview
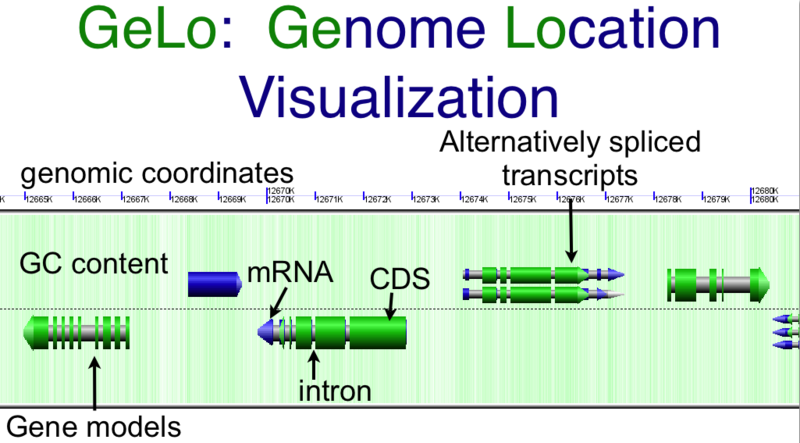
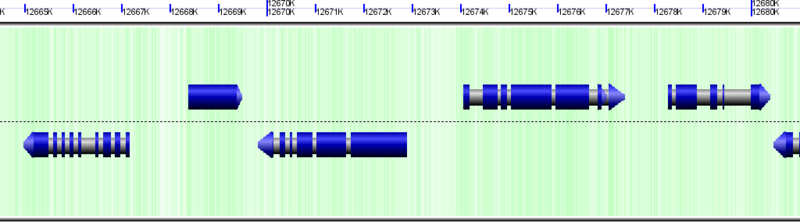
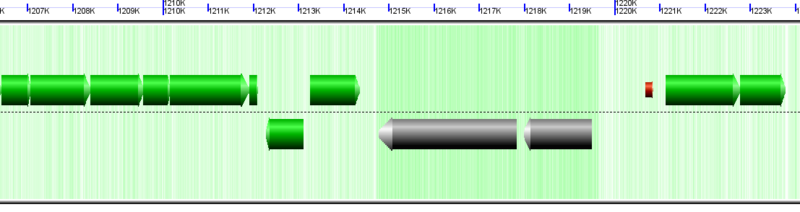
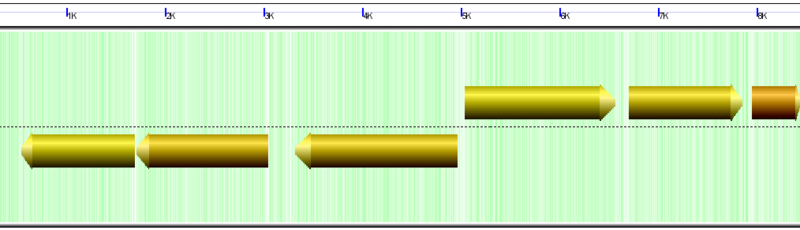
Overview of
GenomeView's visualization using the
GeLo genomic visualization library. Background of chromosome is colored green for GC rich regions and while for AT rich regions. Gene models are drawn as composite colored arrows such that gray is the extent of the gene, blue is mRNA, and green is protein coding
CDS sequence. Overlapping genomic features are detected and expanded to show alternatively spiced transcripts
Chromosome Background
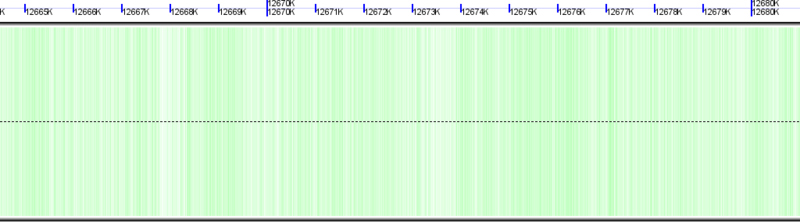
Background of chromosome colored green to show GC rich regions and white to show AT rich regions
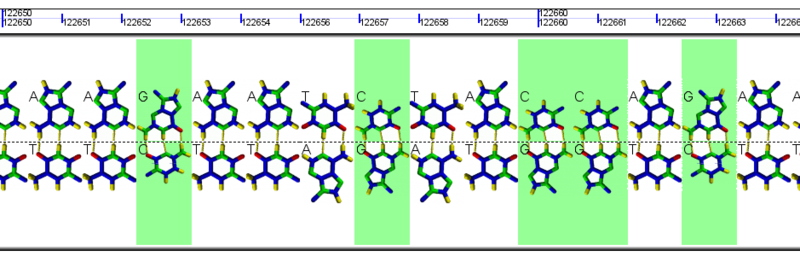
Example GeLo graphics using images of nucleotides in the background. These are also colored green for GC and white for AT
Genes
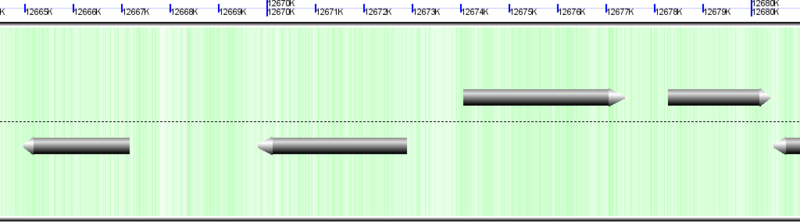
Gene models drawn as gray arrows
mRNAs
mRNA drawn as blue arrows (on top of gray genes)
CDSs
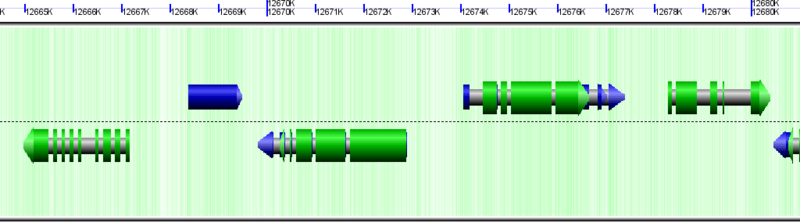
Protein coding regions (CDS) drawn as green arrows (on top of gray genes and blue mRNAs)
Unsequenced regions
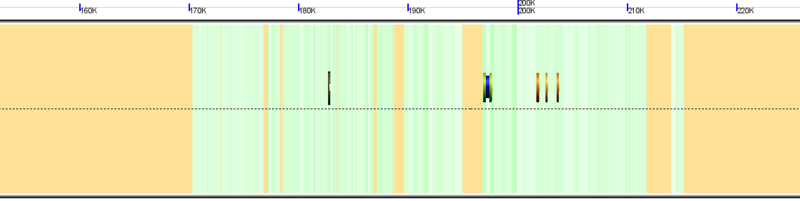
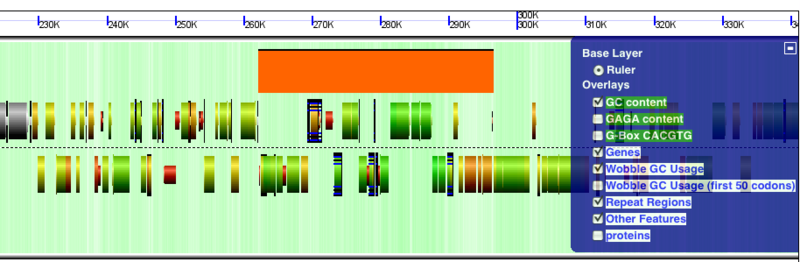
Genomic region with unsequenced regions colored orange from the genome of Carica papaya
Masked regions
Genomic region with masked sequence colored purple
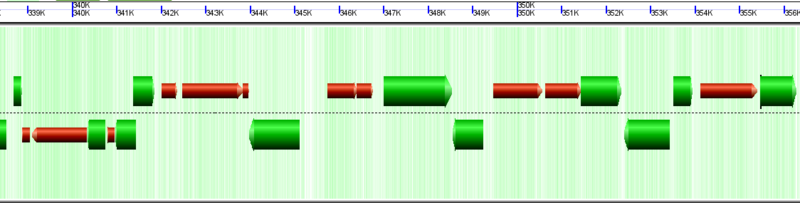
rRNA genes
Microbial (archaea) genomic region with 23S and 16S rRNA genes drawn as wide gray arrows
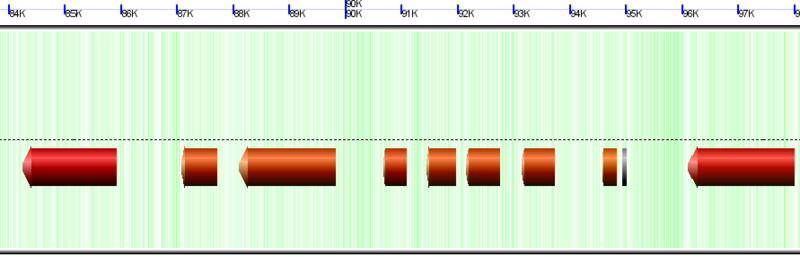
Pseudogenes
Microbial (archaea) genomic region with many pseudogenes drawn as orange-red arrows
Wobble GC content filter
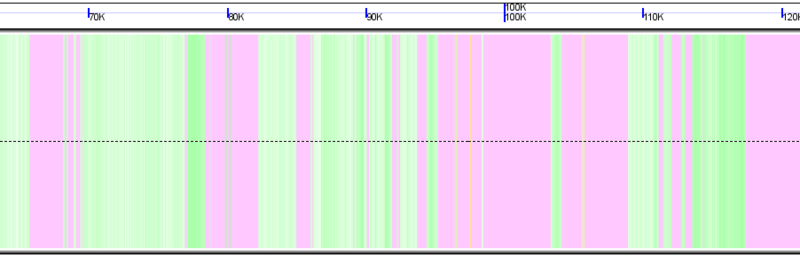
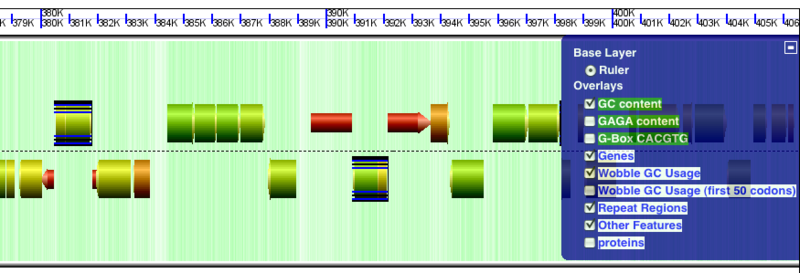
Wobble GC content colored for Chlamydomonas reinhardtii genome. Green means high GC content in codon wobble positions
Wobble GC content colored for Chlamydomonas reinhardtii chloroplast genome. Red means low GC content in codon wobble positions
Wobble GC content colored for Chlamydomonas reinhardtii mitochondria genome. Yellow means ~50% GC content in codon wobble positions
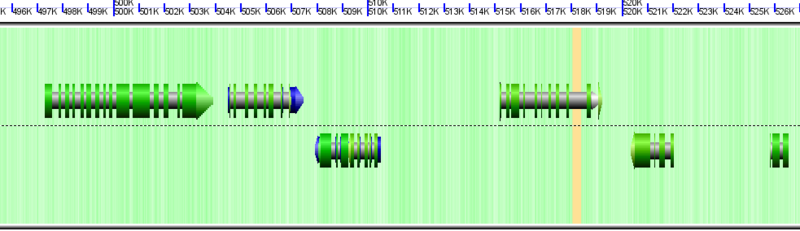
GEvo Links
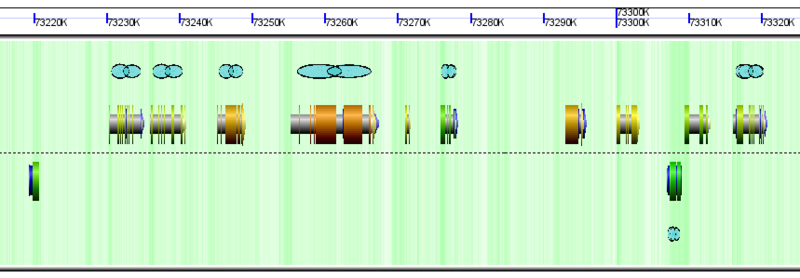
GenomeView showing glyphs for links to GEvo. These glyphs are blue "links" and are displayed when a genomic feature has a link to GEvo for syntenic analysis of syntelogs.
Repeat Regions
GenomeView showing repeat regions as black and blue boxes around a sequence and gene. There are two IS elements highlighted by these boxes that have each jumped into a gene and disrupted it.
Other Features
GenomeView showing "other features" as orange boxes. This other features is a prophage that has integrated in the genome of Escherichia coli K12 strain K-12 substrain MG1655.


